APC 2005 Annual Report Download - page 20
Download and view the complete annual report
Please find page 20 of the 2005 APC annual report below. You can navigate through the pages in the report by either clicking on the pages listed below, or by using the keyword search tool below to find specific information within the annual report.-
 1
1 -
2
-
3
-
4
-
5
-
6
-
7
-
8
-
9
-
 10
10 -
 11
11 -
 12
12 -
 13
13 -
 14
14 -
 15
15 -
 16
16 -
 17
17 -
 18
18 -
 19
19 -
 20
20 -
 21
21 -
 22
22 -
 23
23 -
 24
24 -
 25
25 -
 26
26 -
 27
27 -
 28
28 -
 29
29 -
 30
30 -
31
-
32
-
33
-
34
-
35
-
36
-
37
-
38
-
39
-
40
-
41
-
42
-
43
-
44
-
45
-
46
-
47
-
48
-
49
-
50
-
51
-
52
-
53
-
54
-
55
-
56
-
57
-
58
-
59
-
60
-
61
-
62
-
63
-
64
-
65
-
66
-
67
-
68
-
69
-
70
-
71
-
72
-
73
-
74
-
75
-
76
-
77
-
78
-
79
-
80
-
81
-
82
-
83
-
84
-
85
-
86
-
87
-
88
-
89
-
90
-
91
-
92
-
93
-
94
-
95
-
96
-
97
-
98
-
99
-
100
-
101
-
102
-
103
-
104
-
105
-
106
-
107
-
108
-
109
-
110
-
111
-
112
-
113
-
114
-
115
-
116
-
117
-
118
-
119
-
120
-
121
-
122
-
123
-
124
-
125
-
126
-
127
-
128
-
129
-
130
-
131
-
132
-
133
-
134
-
135
-
136
-
137
-
138
-
139
-
140
-
141
-
142
-
143
-
144
-
145
-
146
-
147
-
148
-
149
-
150
-
151
-
152
-
153
-
154
-
155
-
156
-
157
-
158
-
159
-
160
-
161
-
162
-
163
-
164
 |
 |

18
9
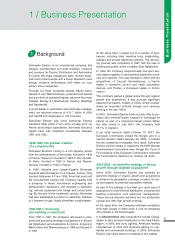
Workforce by region*
n Europe
n North America
n Asia-Pacific
n Rest of the world
* Average number of
permanent and temporary employees: 88,670.
49%
20%
24%
7%
Risk factors
We operate worldwide,
in competitive and cyclical markets
The worldwide markets for our products are competi-
tive in terms of pricing, product and service quality,
development and introduction time and customer serv-
ice. We face strong competitors, some of whom are
larger or developing in certain lower cost countries. We
are exposed to cyclical fluctuations in the rate of eco-
nomic growth of, and level of capital expenditures in,
the various countries in which we operate, though the
impact of downturns in a particular market may be lim-
ited by the diversified nature of our end user markets.
As we also operate in emerging or developing coun-
tries for approximately 30% of our business, we are
exposed to the risks associated with those markets.
The development and success
of our products depends on our ability
to develop new products and services
and adapt to the market
The markets in which we operate experience rapid
and significant changes due to the introduction of
innovative technologies. Introducing new technology
products and innovative services, which we must do
on an ongoing basis to meet our customers’ needs,
requires a significant commitment to research and
development, which may not result in success. Our
sales and margins may suffer if we invest in technolo-
gies that do not function as expected or are not
accepted in the marketplace or if our products, sys-
tems or service offers are not brought to market in a
timely manner, become obsolete or are not responsive
to our customers’ requirements.
In order to meet these challenges, we have an R&D
budget which, at 5% of revenue, is among the highest
in the industry. It covers 6,500 employees around the
world and development centers in 25 countries. This
ongoing commitment has allowed us to accelerate
time to market and leverage the technology of strate-
gic partners with whom we have also forged alliances
to expand our lineup or geographic coverage. We have
set up global development centers to bring all of our
electrotechnical, electronic, electromechanical, soft-
ware and other technical competencies together and
to create technology parks in China, the US, France
and Japan.
Global support centers have also been established in
Mexico, India and China to provide the technical parks
with additional skills and development capacity at a
very competitive cost.
As part of our new2program, we have introduced com-
petency plans to help meet our growth and efficiency
objectives. These plans are designed to define the
competencies we’ll be needing based on the 3-year
business plan and determine appropriate training, hir-
ing and mobility programs to acquire those competen-
cies.
In competency reviews with their managers, all
employees will be able to discuss ongoing changes in
our businesses and skill sets to prepare their career
paths effectively.
Trained, motivated teams
Training is a key success factor at all levels of our
organization. Training encourages initiative, skill shar-
ing and project-based management.
We are counting heavily on new information and com-
munication technologies to make training available to
as many employees as possible around the world.
We are also forging partnerships with prestigious tech-
nical schools and universities in host countries. E-
learning modules are available for marketing, sales
and English as a foreign language training. Nearly
53,000 team members have access to e-mail and the
Company's various intranet sites.
Schneider Electric University develops programs for
high-level managers and experts. These courses,
which primarily concern our vision, strategy and Com-
pany Program objectives, give managers a better view
of Schneider Electric’s challenges and commitments.
Lastly, we give employees a stake in achieving targets
and in the Company’s performance through profit-
linked incentive plans, employee share ownership,
stock option programs and bonuses.