APC 2005 Annual Report Download - page 7
Download and view the complete annual report
Please find page 7 of the 2005 APC annual report below. You can navigate through the pages in the report by either clicking on the pages listed below, or by using the keyword search tool below to find specific information within the annual report.-
 1
1 -
 2
2 -
 3
3 -
 4
4 -
 5
5 -
 6
6 -
 7
7 -
 8
8 -
 9
9 -
 10
10 -
 11
11 -
 12
12 -
 13
13 -
 14
14 -
 15
15 -
 16
16 -
 17
17 -
 18
18 -
19
-
20
-
21
-
22
-
23
-
24
-
25
-
26
-
27
-
28
-
29
-
30
-
31
-
32
-
33
-
34
-
35
-
36
-
37
-
38
-
39
-
40
-
41
-
42
-
43
-
44
-
45
-
46
-
47
-
48
-
49
-
50
-
51
-
52
-
53
-
54
-
55
-
56
-
57
-
58
-
59
-
60
-
61
-
62
-
63
-
64
-
65
-
66
-
67
-
68
-
69
-
70
-
71
-
72
-
73
-
74
-
75
-
76
-
77
-
78
-
79
-
80
-
81
-
82
-
83
-
84
-
85
-
86
-
87
-
88
-
89
-
90
-
91
-
92
-
93
-
94
-
95
-
96
-
97
-
98
-
99
-
100
-
101
-
102
-
103
-
104
-
105
-
106
-
107
-
108
-
109
-
110
-
111
-
112
-
113
-
114
-
115
-
116
-
117
-
118
-
119
-
120
-
121
-
122
-
123
-
124
-
125
-
126
-
127
-
128
-
129
-
130
-
131
-
132
-
133
-
134
-
135
-
136
-
137
-
138
-
139
-
140
-
141
-
142
-
143
-
144
-
145
-
146
-
147
-
148
-
149
-
150
-
151
-
152
-
153
-
154
-
155
-
156
-
157
-
158
-
159
-
160
-
161
-
162
-
163
-
164
 |
 |

5
2001 2002 20032004 2005
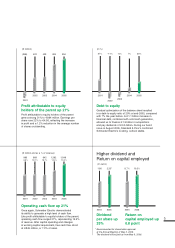
( million and as a % of revenue)
966
9.8%
968
10.7%
942
10.7%
1,282
12.4%
1,548
13.3%
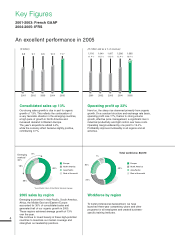
Operating cash flow up 21%
Once again, Schneider Electric demonstrated
its ability to generate a high level of cash flow.
Like profit attributable to equity holders of the parent,
operating cash flow surged 21%, representing 13.3%
of revenue. After capital spending and changes
in working capital requirement, free cash flow stood
at 849 million, or 7.3% of sales.
2001
2002 20032004 2005
( million)
(986) 422 433 824 994
Profit attributable to equity
holders of the parent up 21%
Profit attributable to equity holders of the parent
grew a strong 21% to 994 million. Earnings per
share rose 22% to 4.56, reflecting the increase
in profit and a 1.2% reduction in the average number
of shares outstanding.
2004 2005 2004 2005
(in euros)
1.80 2.25* 9.7%10.5%
Dividend
per share up
25%
2001
2002 2003
2004 2005
(in %)
27%-11%-5%7%20%
Debt to equity
Gradual optimization of the balance sheet resulted
in a debt-to-equity ratio of 20% at end-2005, compared
with 7% the year before. A 1.1 billion increase in
financial debt, combined with solid cash generation,
allowed us to finance 1.3 billion in acquisitions
and pay dividends of 0.5 billion. During our bond
issue in August 2005, Standard & Poor’s confirmed
Schneider Electric’s A rating, outlook stable.
Return on
capital employed up
0.8 point
* Recommended for shareholder approval
at the Annual Meeting of May 3, 2006.
The dividend will be paid as from May 9, 2006.
Higher dividend and
Return on capital employed