APC 2005 Annual Report Download - page 81
Download and view the complete annual report
Please find page 81 of the 2005 APC annual report below. You can navigate through the pages in the report by either clicking on the pages listed below, or by using the keyword search tool below to find specific information within the annual report.-
 1
1 -
2
-
3
-
4
-
5
-
6
-
7
-
8
-
9
-
10
-
11
-
12
-
13
-
14
-
15
-
16
-
17
-
18
-
19
-
20
-
21
-
22
-
23
-
24
-
25
-
26
-
27
-
28
-
29
-
30
-
31
-
32
-
33
-
34
-
35
-
36
-
37
-
38
-
39
-
40
-
41
-
42
-
43
-
44
-
45
-
46
-
47
-
48
-
49
-
50
-
51
-
52
-
53
-
54
-
55
-
56
-
57
-
58
-
59
-
60
-
61
-
62
-
63
-
64
-
65
-
66
-
67
-
68
-
69
-
70
-
 71
71 -
 72
72 -
 73
73 -
 74
74 -
 75
75 -
 76
76 -
 77
77 -
 78
78 -
 79
79 -
 80
80 -
 81
81 -
 82
82 -
 83
83 -
 84
84 -
 85
85 -
 86
86 -
 87
87 -
 88
88 -
 89
89 -
 90
90 -
 91
91 -
92
-
93
-
94
-
95
-
96
-
97
-
98
-
99
-
100
-
101
-
102
-
103
-
104
-
105
-
106
-
107
-
108
-
109
-
110
-
111
-
112
-
113
-
114
-
115
-
116
-
117
-
118
-
119
-
120
-
121
-
122
-
123
-
124
-
125
-
126
-
127
-
128
-
129
-
130
-
131
-
132
-
133
-
134
-
135
-
136
-
137
-
138
-
139
-
140
-
141
-
142
-
143
-
144
-
145
-
146
-
147
-
148
-
149
-
150
-
151
-
152
-
153
-
154
-
155
-
156
-
157
-
158
-
159
-
160
-
161
-
162
-
163
-
164
 |
 |

79
Consolidated Financial Statements
2.1 - Treasury stock
IAS 32 requires all Schneider Electric shares held by
the parent company and subsidiaries to be recorded
as a deduction from equity, whatever the purpose for
which the shares are held. In accordance with this
standard, Schneider Electric shares with a value of
87 million carried in assets in the French GAAP bal-
ance sheet at December 31, 2004, under "Cash and
cash equivalents", have been reclassified as a deduc-
tion from equity.
2.2 - Available-for-sale financial assets
In accordance with IAS 39, investments in non-consol-
idated companies have been reclassified as available-
for-sale financial assets and measured at fair value
(corresponding to market value in the case of listed
shares). Gains and losses arising from remeasure-
ment at fair value are accumulated in equity under
"Other reserves".
Fair value adjustments to available-for-sale financial
assets at January 1, 2005 amounted to 44.2 million.
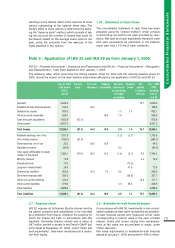
Note 2 - Application of IAS 32 and IAS 39 as from January 1, 2005
IAS 32 –
Financial Instruments
–
Disclosure and Presentation
and IAS 39 –
Financial Instruments – Recognition
and Measurement
– have been applied as from January 1, 2005.
The following table, which reconciles the closing balance sheet for 2004 with the opening balance sheet for
2005, shows the impact on the main balance sheet items affected by the application of IAS 32 and IAS 39.
Dec. 31, 2004 Treasury Fair value Hedging Derivative Perpetual Put Jan. 1, 2005
IFRS before stock adjustment instruments instruments bonds granted IFRS
IAS 32 not qualifying to minority including
and 39 for hedge interests IAS 32
accounting and 39
Goodwill 4,462.3 76.7 4,539.0
Available-for-sale financial assets 154.3 44.2 198.5
Deferred tax assets 830.3 1.0 1.4 832.7
Other accounts receivable 529.1 19.9 1.8 550.8
Cash and cash equivalents 1,062.8 (87.0) 975.8
Other assets 6,257.3 6,257.3
Total Assets 13,296.1 (87.0) 44.2 19.9 2.8 1.4 76.7 13,354.1
Retained earnings, net of tax 1,797.5 (1.2) (2.7) 1,793.6
Own shares reserve (199.7) (87.0) (286.7)
Other reserves, net of tax 22.3 29.0 12.9 64.2
Translation reserve (84.5) 0.2 (84.3)
Total equity attributable to equity
holders of the parent 7,395.1 (87.0) 29.0 12.9 (1.0) (2.7) 0.0 7,346.3
Minority interests 72.8 3.4 76.2
Perpetual bonds 73.3 (73.3) -
Long-term financial debt 24.9 47.6 72.5
Deferred tax liabilities 203.2 15.2 7.0 0.5 225.9
Short-term financial debt 254.3 (26.6) 227.7
Other non current liabilities 104.4 73.3 177.7
Other current liabilities 279.2 3.3 56.4 338.9
Other liabilities 4,888.9 4,888.9
Total Liabilities 13,296.1 (87.0) 44.2 19.9 2.8 1.4 76.7 13,354.1
standing for the dilutive effect of the exercise of stock
options outstanding at the balance sheet date. The
dilutive effect of stock options is determined by apply-
ing the "treasury stock" method, which consists of tak-
ing into account the number of shares that could be
purchased, based on the average share price for the
year, using the proceeds from the exercise of the
rights attached to the options.
1.24 - Statement of Cash Flows
The consolidated statement of cash flows has been
prepared using the "indirect method", which consists
of reconciling net profit to net cash provided by oper-
ations. Net cash and cash equivalents represent cash
and cash equivalents as presented in the balance
sheet (see note 1.15) net of bank overdrafts.