APC 2005 Annual Report Download - page 6
Download and view the complete annual report
Please find page 6 of the 2005 APC annual report below. You can navigate through the pages in the report by either clicking on the pages listed below, or by using the keyword search tool below to find specific information within the annual report.-
 1
1 -
 2
2 -
 3
3 -
 4
4 -
 5
5 -
 6
6 -
 7
7 -
 8
8 -
 9
9 -
 10
10 -
 11
11 -
 12
12 -
 13
13 -
 14
14 -
 15
15 -
 16
16 -
 17
17 -
18
-
19
-
20
-
21
-
22
-
23
-
24
-
25
-
26
-
27
-
28
-
29
-
30
-
31
-
32
-
33
-
34
-
35
-
36
-
37
-
38
-
39
-
40
-
41
-
42
-
43
-
44
-
45
-
46
-
47
-
48
-
49
-
50
-
51
-
52
-
53
-
54
-
55
-
56
-
57
-
58
-
59
-
60
-
61
-
62
-
63
-
64
-
65
-
66
-
67
-
68
-
69
-
70
-
71
-
72
-
73
-
74
-
75
-
76
-
77
-
78
-
79
-
80
-
81
-
82
-
83
-
84
-
85
-
86
-
87
-
88
-
89
-
90
-
91
-
92
-
93
-
94
-
95
-
96
-
97
-
98
-
99
-
100
-
101
-
102
-
103
-
104
-
105
-
106
-
107
-
108
-
109
-
110
-
111
-
112
-
113
-
114
-
115
-
116
-
117
-
118
-
119
-
120
-
121
-
122
-
123
-
124
-
125
-
126
-
127
-
128
-
129
-
130
-
131
-
132
-
133
-
134
-
135
-
136
-
137
-
138
-
139
-
140
-
141
-
142
-
143
-
144
-
145
-
146
-
147
-
148
-
149
-
150
-
151
-
152
-
153
-
154
-
155
-
156
-
157
-
158
-
159
-
160
-
161
-
162
-
163
-
164
 |
 |

4
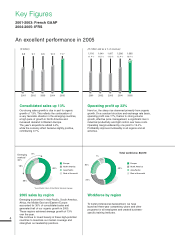
Key Figures
( billion)
9.89.1 8.810.311.7
2001 2002 20032004 2005
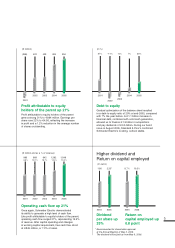
Consolidated sales up 13%
Our strong sales growth is due in part to organic
growth of 7.9%. This reflects the continuation of
a very favorable situation in the emerging countries,
a high pace of growth in North America and
increased demand in Western Europe.
The year’s acquisitions added 4.2%,
while the currency effect became slightly positive,
contributing 0.7%.
2001 2002 20032004 2005
( million and as a % of revenue)
1,116
11.4 %
1,040
11.5 %
1,007
11.5 %
1,286
12.4 %
1,565
13.4 %
Operating profit up 22%
Here too, the sharp rise stemmed primarily from organic
growth. On a constant structure and exchange rate basis,
operating profit rose 17%, thanks to strong volume
growth, effective price management, a significant rise in
industrial productivity and tight control over base costs.
Operating margin widened by one point to 13.4%.
Profitability improved noticeably in all regions and all
activities.
* Asia-Pacific, Rest of the World, Eastern Europe.
48%
18%
8%
26%
Emerging
markets*
30%
Europe
North America
Asia-Pacific
Rest of the world
Europe
North America
Asia-Pacific
Rest of the world
49%
20%
24%
7%
2005 sales by region
Emerging economies in Asia-Pacific, South America,
Africa, the Middle East and Eastern Europe
accounted for 30% of consolidated sales and
generated half of our organic growth in 2005.
These regions achieved average growth of 13%
over the year.
We continue to invest heavily in these high-potential
countries to maximize our market coverage and
strengthen our leadership positions.
Workforce by region
To foster professional development, we have
launched three-year competency plans and other
programs for all employees and created business-
specific training institutes.
An excellent performance in 2005
2001-2003: French GAAP
2004-2005: IFRS
Total workforce: 88,670