APC 2005 Annual Report Download - page 89
Download and view the complete annual report
Please find page 89 of the 2005 APC annual report below. You can navigate through the pages in the report by either clicking on the pages listed below, or by using the keyword search tool below to find specific information within the annual report.-
 1
1 -
2
-
3
-
4
-
5
-
6
-
7
-
8
-
9
-
10
-
11
-
12
-
13
-
14
-
15
-
16
-
17
-
18
-
19
-
20
-
21
-
22
-
23
-
24
-
25
-
26
-
27
-
28
-
29
-
30
-
31
-
32
-
33
-
34
-
35
-
36
-
37
-
38
-
39
-
40
-
41
-
42
-
43
-
44
-
45
-
46
-
47
-
48
-
49
-
50
-
51
-
52
-
53
-
54
-
55
-
56
-
57
-
58
-
59
-
60
-
61
-
62
-
63
-
64
-
65
-
66
-
67
-
68
-
69
-
70
-
71
-
72
-
73
-
74
-
75
-
76
-
77
-
78
-
 79
79 -
 80
80 -
 81
81 -
 82
82 -
 83
83 -
 84
84 -
 85
85 -
 86
86 -
 87
87 -
 88
88 -
 89
89 -
 90
90 -
 91
91 -
 92
92 -
 93
93 -
 94
94 -
 95
95 -
 96
96 -
 97
97 -
 98
98 -
 99
99 -
100
-
101
-
102
-
103
-
104
-
105
-
106
-
107
-
108
-
109
-
110
-
111
-
112
-
113
-
114
-
115
-
116
-
117
-
118
-
119
-
120
-
121
-
122
-
123
-
124
-
125
-
126
-
127
-
128
-
129
-
130
-
131
-
132
-
133
-
134
-
135
-
136
-
137
-
138
-
139
-
140
-
141
-
142
-
143
-
144
-
145
-
146
-
147
-
148
-
149
-
150
-
151
-
152
-
153
-
154
-
155
-
156
-
157
-
158
-
159
-
160
-
161
-
162
-
163
-
164
 |
 |

87
Consolidated Financial Statements
a) Consolidated balance sheet of Clipsal Asia
Dec. 31, Dec. 31,
2005 2004
(in millions of euros) *
estimated definitive
Non current assets 53.4 44.8
Current assets 119.3 108.3
Total assets 172.7 153.1
Equity attributable to equity
holders of the parent 83.3 80.8
Minority interests 6.7 4.2
Non current liabilities 2.2 2.0
Current liabilities 80.5 66.1
Total liabilities and equity 172.7 153.1
* Translated at the closing rate 2005 : HKD=EUR0.109321
2004 : HKD=EUR0.094446.
b) Consolidated income statement of Clipsal Asia
Dec. 31, Dec. 31,
2005 2004
(in millions of euros) *
estimated definitive
Revenue 120.5 108.2
Operating (loss)/income (4.1) (3.8)
Financial expense (1.8) (1.5)
Exceptional items - -
Income taxes (1.2) (1.2)
Minority interests (2.0) (0.7)
Net loss (9.1) (7.2)
* Translated at the average rate 2005 : HKD=EUR0.103137
2004 : HKD=EUR0.103339.
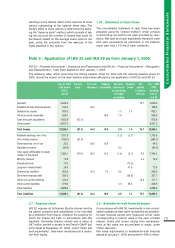
Note 8 - Non current financial assets
8.1 - Available-for-sale financial assets
Non-consolidated investments classified as available-for-sale financial assets are as follows:
Dec. 31, 2005 Jan. 1, 2005* Dec. 31, 2004
% interest Cost Revaluation/ Fair Fair Net
impairment value value
I – Listed available
for sale financial assets
AXA (1) 0.40% 82.1 158.2 240.3 120.9 76.7
Gold Peak Industries Holding Ltd 10.06% 10.6 (6.0) 4.6 10.1 10.1
Other listed AFS - 38.0 - 38.0 5.5 5.5
Total listed AFS 130.7 152.2 282.9 136.5 92.3
II – Unlisted available
for sale financial assets
SE Relays LLC (2) 100.00% - - - 26.5 26.5
Eb@se France (3) 100.00% 20.7 (20.7) 0.0 - -
Abacus Engineered Systems (2) 100.00% - - - 16.8 16.8
Comipar 4.15% 16.4 (16.4) 0.0 - -
Legrand NS 10.1 - 10.1 - -
Easy Plug SAS (3) 50.00% 8.8 (8.8) 0.0 - -
Paramer (4) 98.96% 7.3 (1.5) 5.8 5.5 5.5
SE Venture 100.00% 6.6 (6.6) 0.0 - -
Simak (4) 98.50% 5.5 (0.5) 5.0 4.5 4.5
Other unlisted AFS (5) - 29.1 (17.5) 11.6 8.7 8.7
Total unlisted AFS 104.5 (72.0) 32.5 62.0 62.0
Financial assets available for sale 235.2 80.2 ** 315.4 198.5 154.3
* IAS 32/39 applied as from January 1, 2005.
** Including a
5.7 million net loss in fair value recognized in the 2005 statement of income.
(1) Formerly FINAXA. (4) Inactive companies.
(2) Consolidated as from January 1, 2005. (5) Valued at less than
5 million each.
(3) Removed from the scope of consolidation – in liquidation.
Fair value corresponds to the closing quoted price for investments quoted in an active market and the carrying
amount for non-quoted investments. Net gains arising from remeasurement at fair value of listed investments,
recorded in equity under "Other reserves" (see note 14.7), totaled 115.6 million, of which 114 million for
shares in AXA (formerly FINAXA).