APC 2005 Annual Report Download - page 13
Download and view the complete annual report
Please find page 13 of the 2005 APC annual report below. You can navigate through the pages in the report by either clicking on the pages listed below, or by using the keyword search tool below to find specific information within the annual report.-
 1
1 -
2
-
 3
3 -
 4
4 -
 5
5 -
 6
6 -
 7
7 -
 8
8 -
 9
9 -
 10
10 -
 11
11 -
 12
12 -
 13
13 -
 14
14 -
 15
15 -
 16
16 -
 17
17 -
 18
18 -
 19
19 -
 20
20 -
 21
21 -
 22
22 -
 23
23 -
24
-
25
-
26
-
27
-
28
-
29
-
30
-
31
-
32
-
33
-
34
-
35
-
36
-
37
-
38
-
39
-
40
-
41
-
42
-
43
-
44
-
45
-
46
-
47
-
48
-
49
-
50
-
51
-
52
-
53
-
54
-
55
-
56
-
57
-
58
-
59
-
60
-
61
-
62
-
63
-
64
-
65
-
66
-
67
-
68
-
69
-
70
-
71
-
72
-
73
-
74
-
75
-
76
-
77
-
78
-
79
-
80
-
81
-
82
-
83
-
84
-
85
-
86
-
87
-
88
-
89
-
90
-
91
-
92
-
93
-
94
-
95
-
96
-
97
-
98
-
99
-
100
-
101
-
102
-
103
-
104
-
105
-
106
-
107
-
108
-
109
-
110
-
111
-
112
-
113
-
114
-
115
-
116
-
117
-
118
-
119
-
120
-
121
-
122
-
123
-
124
-
125
-
126
-
127
-
128
-
129
-
130
-
131
-
132
-
133
-
134
-
135
-
136
-
137
-
138
-
139
-
140
-
141
-
142
-
143
-
144
-
145
-
146
-
147
-
148
-
149
-
150
-
151
-
152
-
153
-
154
-
155
-
156
-
157
-
158
-
159
-
160
-
161
-
162
-
163
-
164
 |
 |

11
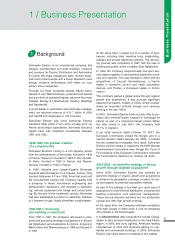
The Buildings market, which accounted for 40% of
consolidated revenue in 2005, includes office build-
ings, hotels, hospitals, shopping centers, manufactur-
ing facilities, sports and cultural centers and ships.
The market’s requirements range from electrical dis-
tribution, management, optimization and reliability to
data transmission networks, building automation and
control systems and solutions to reduce energy con-
sumption.
The Residential market, which represented 12% of
revenue in 2005, is a strategic priority for Schneider
Electric because of its significant growth prospects. It
is essentially a local market with limited cyclical expo-
sure and diverse opportunities depending on the
region. In mature markets such as Western Europe
and the US, renovation and home improvement often
represent nearly two-thirds of the market, which is
driven by demand for comfort and safety. In emerging
markets, on the other hand, we are targeting new-
building, with a particular focus on large housing pro-
grams in Eastern Europe, China and other Asian
countries.
Forefront
positions worldwide*
Schneider Electric is the world’s only power and con-
trol specialist. We have expanded our lineup to meet
customer needs more effectively by staking out solid
positions in new activities that are strategically related
to our core businesses. These include energy man-
agement, building automation and security, and sen-
sors and actuators for repetitive machines.
We have many rivals, but they are often limited in their
scope. The competition breaks down into four broad
categories:
Large non-specialist manufacturers with diversified
business bases, such as ABB, General Electric, Mit-
subishi Electric and Siemens.
Multinational specialist manufacturers, such as
Omron and Rockwell Automation.
Medium-sized companies– primarily in electrical
distribution–with a more regional presence, including
Eaton, Hager and Legrand.
Smaller local companies such as Gewiss in Italy,
Simon in Spain, Vacon in Sweden, Stick in Germany
and STI in the US.
The only player who complies with
all national and international standards
Schneider Electric is the only player who complies
with all prevailing standards around the world. The
majority of our lineup complies with world-recognized
International Electrotechnical Commission (IEC) stan-
dards.
In North America, our products generally meet stan-
dards set by the National Electrical Manufacturers
Association (NEMA), Underwriters Laboratory (UL) or
American National Standards Institute (ANSI).
Products in the UK, Australia and Asia-Pacific comply
with British Standards, while those in China and
Japan meet the China Compulsory Certification
(CCC) and Japan Industrial Standard (JIS).
Since our products comply with the dominant stan-
dards in our host markets, we are able to meet most
all of our customers’ needs.
Number 1 worldwide
in electrical distribution, number two
worldwide in ultra terminal distribution
Our electrical distribution lineup ensures a safe, reli-
able, uninterrupted and effective supply of electric
power. Electrical distribution accounted for 63% of
consolidated revenue in 2005. Our portfolio is divided
into two main categories:
Medium voltage: electrical switchgear and equip-
ment from 1 kV to 52 kV. The products in this catego-
ry are generally used to transform and manage high
voltage electricity from the distribution grid. The medi-
um voltage power is then sent directly to end users in
industrial buildings and large commercial installations
or transformed into low voltage power for small com-
mercial buildings and homes.
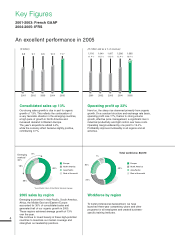
2005 consolidated revenue by region
n Europe
n North America
n Asia-Pacific
n Rest of the world
* Asia-Pacific, Rest of the World, Eastern Europe.
48%
26%
18%
8%
Emerging
markets*
30%
* This document provides information on Schneider Electric’s
businesses and competitive position. To the best of our knowl-
edge, no exhaustive report has been drafted on products and sys-
tems for electrical distribution, ultra terminal distribution, automa-
tion and control. We have compiled data on our businesses
through formal and informal contacts with industry professionals,
especially trade associations. We estimate our market positions
based on this data and actual revenue in each business.
Business Presentation
3