APC 2005 Annual Report Download - page 128
Download and view the complete annual report
Please find page 128 of the 2005 APC annual report below. You can navigate through the pages in the report by either clicking on the pages listed below, or by using the keyword search tool below to find specific information within the annual report.-
 1
1 -
2
-
3
-
4
-
5
-
6
-
7
-
8
-
9
-
10
-
11
-
12
-
13
-
14
-
15
-
16
-
17
-
18
-
19
-
20
-
21
-
22
-
23
-
24
-
25
-
26
-
27
-
28
-
29
-
30
-
31
-
32
-
33
-
34
-
35
-
36
-
37
-
38
-
39
-
40
-
41
-
42
-
43
-
44
-
45
-
46
-
47
-
48
-
49
-
50
-
51
-
52
-
53
-
54
-
55
-
56
-
57
-
58
-
59
-
60
-
61
-
62
-
63
-
64
-
65
-
66
-
67
-
68
-
69
-
70
-
71
-
72
-
73
-
74
-
75
-
76
-
77
-
78
-
79
-
80
-
81
-
82
-
83
-
84
-
85
-
86
-
87
-
88
-
89
-
90
-
91
-
92
-
93
-
94
-
95
-
96
-
97
-
98
-
99
-
100
-
101
-
102
-
103
-
104
-
105
-
106
-
107
-
108
-
109
-
110
-
111
-
112
-
113
-
114
-
115
-
116
-
117
-
 118
118 -
 119
119 -
 120
120 -
 121
121 -
 122
122 -
 123
123 -
 124
124 -
 125
125 -
 126
126 -
 127
127 -
 128
128 -
 129
129 -
 130
130 -
 131
131 -
 132
132 -
 133
133 -
 134
134 -
 135
135 -
 136
136 -
 137
137 -
 138
138 -
139
-
140
-
141
-
142
-
143
-
144
-
145
-
146
-
147
-
148
-
149
-
150
-
151
-
152
-
153
-
154
-
155
-
156
-
157
-
158
-
159
-
160
-
161
-
162
-
163
-
164
 |
 |

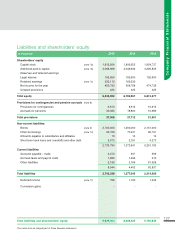
126
6 / Company Financial Statements
at December 31, 2005
Assets
(
€
thousands)
Depreciation 2005 2004 2003
amortization,
Cost
and provisions
Net Net Net
Non-current assets
Intangible assets
(note 1a)
Intangible rights 27,474 (27,474) - - -
Property, plant and equipment
(note 1b)
Land 3,444 - 3,444 3,671 3,917
Buildings 206 (206) - - -
Other 1,713 (510) 1,203 1,207 1,336
32,837 (28,190) 4,647 4,878 5,253
Investments
S
hares in subsidiaries and affiliates
(note 2a)
2,051,782 (37,674) 2,014,108 1,880,685 1,875,649
Other investments
(note 2b)
149,267 (16,432) 132,835 159,348 225,641
Advances to subsidiaries
and affiliates
(note 2c)
2,972,934 (173) 2,972,761 2,972,874 2,012,784
Other
(note 2d)
177,161 - 177,161 189,921 159,165
5,351,144 (54,279) 5,296,865 5,202,828 4,273,239
Total non-current assets 5,383,981 (82,469) 5,301,512 5,207,706 4,278,492
Current assets
Accounts receivable
Accounts receivable – trade 52 - 52 228 2,724
Other
(note 3)
260,325 (45,699) 214,626 131,778 146,385
260,377 (45,699) 214,678 132,006 149,109
Cash and cash equivalents
Marketable securities
(note 4)
182,262 - 182,262 87,046 90,697
Advances to the Group cash pool
(note 5)
3,917,909 - 3,917,909 2,654,394 4,625,146
Other 22 - 22 4 65
4,100,193 - 4,100,193 2,741,444 4,715,908
Total current assets 4,360,570 (45,699) 4,314,871 2,873,450 4,865,017
Accruals and other assets
Prepaid expenses 553 - 553 856 1,095
Deferred charges
(note 6a)
4,573 - 4,573 2,309 3,135
Bond call premiums
(note 6b)
7,485 - 7,485 2,091 2,893
Conversion losses 10 - 10 10 11
Total assets 9,757,172 128,168 9,629,004 8,086,422 9,150,643
The notes form an integral part of these financial statements.
1
Balance Sheet