American Express 2011 Annual Report Download - page 23
Download and view the complete annual report
Please find page 23 of the 2011 American Express annual report below. You can navigate through the pages in the report by either clicking on the pages listed below, or by using the keyword search tool below to find specific information within the annual report.-
 1
1 -
2
-
3
-
4
-
5
-
6
-
7
-
8
-
9
-
10
-
11
-
12
-
 13
13 -
 14
14 -
 15
15 -
 16
16 -
 17
17 -
 18
18 -
 19
19 -
 20
20 -
 21
21 -
 22
22 -
 23
23 -
 24
24 -
 25
25 -
 26
26 -
 27
27 -
 28
28 -
 29
29 -
 30
30 -
 31
31 -
 32
32 -
 33
33 -
34
-
35
-
36
-
37
-
38
-
39
-
40
-
41
-
42
-
43
-
44
-
45
-
46
-
47
-
48
-
49
-
50
-
51
-
52
-
53
-
54
-
55
-
56
-
57
-
58
-
59
-
60
-
61
-
62
-
63
-
64
-
65
-
66
-
67
-
68
-
69
-
70
-
71
-
72
-
73
-
74
-
75
-
76
-
77
-
78
-
79
-
80
-
81
-
82
-
83
-
84
-
85
-
86
-
87
-
88
-
89
-
90
-
91
-
92
-
93
-
94
-
95
-
96
-
97
-
98
-
99
-
100
-
101
-
102
-
103
-
104
-
105
-
106
-
107
-
108
-
109
-
110
-
111
-
112
-
113
 |
 |

AMERICAN EXPRESS COMPANY
2011 FINANCIAL REVIEW
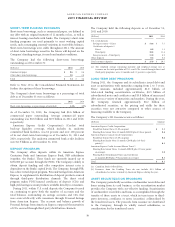
Calculation of Net Interest Yield on Cardmember
Loans
Years Ended December 31,
(Millions, except percentages
and where indicated) 2011 2010 2009
Calculation based on GAAP
information:
Net interest income $ 4,641 $ 4,869 $ 3,124
Average loans (billions) $ 59.1 $ 58.4 $ 34.8
Adjusted net interest income $ 5,345 $ 5,629 $ 3,540
Adjusted average loans (billions) $ 59.0 $ 58.3 $ 34.9
Net interest income divided by
average loans 7.9% 8.3% 9.0%
Net interest yield on cardmember loans 9.1% 9.7% 10.1%
Calculation based on managed
information:
Net interest income $ 4,641 $ 4,869 $ 5,977
Average loans (billions) $ 59.1 $ 58.4 $ 63.8
Adjusted net interest income $ 5,345 $ 5,629 $ 6,646
Adjusted average loans (billions) $ 59.0 $ 58.3 $ 63.9
Net interest yield on cardmember loans 9.1% 9.7% 10.4%
The following discussions regarding Consolidated Results of
Operations and Consolidated Liquidity and Capital Resources
are presented on a basis consistent with GAAP unless otherwise
noted.
Beginning the first quarter of 2011, certain payments to
business partners previously expensed in other expenses have
been reclassified as contra-revenue within discount revenue or as
marketing and promotion expense. These partner payments are
primarily related to certain co-brand contracts where upfront
payments are amortized over the life of the contract. Amounts in
prior periods for this item and certain other amounts have been
reclassified to conform to the current presentation and are
immaterial to the affected line items.
CONSOLIDATED RESULTS OF OPERATIONS FOR
THE THREE YEARS ENDED DECEMBER 31, 2011
The Company’s 2011 consolidated income from continuing
operations increased $842 million or 21 percent to $4.9 billion,
and diluted EPS from continuing operations increased by $0.74
to $4.09. Consolidated income from continuing operations for
2010 increased $1.9 billion or 90 percent to $4.1 billion from
2009, and diluted EPS from continuing operations for 2010
increased by $1.81 to $3.35 from 2009.
Consolidated net income for 2011, 2010 and 2009 was $4.9
billion, $4.1 billion and $2.1 billion, respectively. Net income
included income from discontinued operations of $36 million
for 2011 and losses from discontinued operations of nil and $7
million for 2010 and 2009, respectively.
The Company’s total revenues net of interest expense and total
expenses increased by approximately 9 percent and 13 percent,
respectively, while total provisions for losses decreased by 50
percent in 2011. Assuming no changes in foreign currency
exchange rates from 2010 to 2011, total revenues net of interest
expense and total expenses increased approximately 7 percent
and 11 percent, respectively, while total provisions for losses
decreased approximately 50 percent in 20111.
The Company’s total revenues net of interest expense and total
expenses increased by approximately 13 percent and 20 percent,
respectively, while total provisions for losses decreased by 58
percent in 2010. Assuming no changes in foreign currency
exchange rates from 2009 to 2010, total revenues net of interest
expense and total expenses increased approximately 12 percent
and 19 percent, respectively, while total provisions for losses
decreased approximately 59 percent in 20101.
Results from continuing operations for 2011 included:
폷$153 million ($106 million after-tax) of net charges for costs
related to the Company’s reengineering initiatives; and
폷A $102 million tax benefit related to the favorable resolution
of certain prior years’ tax items.
Results from continuing operations for 2010 included:
폷$127 million ($83 million after-tax) of net charges for costs
related to the Company’s reengineering initiatives.
Results from continuing operations for 2009 included:
폷A $211 million ($135 million after-tax) gain in 2009 on the
sale of 50 percent of the Company’s equity holdings of
Industrial and Commercial Bank of China (ICBC);
폷$190 million ($125 million after-tax) of net charges for costs
related to the Company’s reengineering initiatives; and
폷$180 million ($113 million after-tax) of benefits related to the
accounting for a net investment in the Company’s
consolidated foreign subsidiaries. Refer to Business Segment
Results — Corporate & Other for further discussion.
1The foreign currency adjusted information, a non-GAAP measure, assumes a
constant exchange rate between the periods being compared for purposes of
currency translation into U.S. dollars (i.e., assumes the foreign exchange rates
used to determine results for the current year apply to the corresponding year-
earlier period against which such results are being compared). The Company
believes the presentation of information on a foreign currency adjusted basis is
helpful to investors by making it easier to compare the Company’s
performance in one period to that of another period without the variability
caused by fluctuations in currency exchange rates.
21