American Express 2011 Annual Report Download - page 72
Download and view the complete annual report
Please find page 72 of the 2011 American Express annual report below. You can navigate through the pages in the report by either clicking on the pages listed below, or by using the keyword search tool below to find specific information within the annual report.-
 1
1 -
2
-
3
-
4
-
5
-
6
-
7
-
8
-
9
-
10
-
11
-
12
-
13
-
14
-
15
-
16
-
17
-
18
-
19
-
20
-
21
-
22
-
23
-
24
-
25
-
26
-
27
-
28
-
29
-
30
-
31
-
32
-
33
-
34
-
35
-
36
-
37
-
38
-
39
-
40
-
41
-
42
-
43
-
44
-
45
-
46
-
47
-
48
-
49
-
50
-
51
-
52
-
53
-
54
-
55
-
56
-
57
-
58
-
59
-
60
-
61
-
 62
62 -
 63
63 -
 64
64 -
 65
65 -
 66
66 -
 67
67 -
 68
68 -
 69
69 -
 70
70 -
 71
71 -
 72
72 -
 73
73 -
 74
74 -
 75
75 -
 76
76 -
 77
77 -
 78
78 -
 79
79 -
 80
80 -
 81
81 -
 82
82 -
83
-
84
-
85
-
86
-
87
-
88
-
89
-
90
-
91
-
92
-
93
-
94
-
95
-
96
-
97
-
98
-
99
-
100
-
101
-
102
-
103
-
104
-
105
-
106
-
107
-
108
-
109
-
110
-
111
-
112
-
113
 |
 |

AMERICAN EXPRESS COMPANY
NOTES TO CONSOLIDATED FINANCIAL STATEMENTS
NOTE 5
RESERVES FOR LOSSES
Reserves for losses relating to cardmember loans and receivables
represent management’s best estimate of the losses inherent in
the Company’s outstanding portfolio of loans and receivables.
Management’s evaluation process requires certain estimates and
judgments.
Reserves for these losses are primarily based upon statistical
models that analyze portfolio performance and reflect
management’s judgment regarding overall reserve adequacy. The
models take into account several factors, including loss
migration rates and average losses and recoveries over an
appropriate historical period. Management considers whether to
adjust the models for specific factors such as increased risk in
certain portfolios, impact of risk management initiatives on
portfolio performance and concentration of credit risk based on
factors such as vintage, industry or geographic regions. In
addition, management may increase or decrease the reserves for
losses on cardmember loans for other external environmental
factors including leading economic and market indicators such
as the unemployment rate, home price indices, Gross Domestic
Product (GDP), non-farm payrolls, personal consumption
expenditures index, consumer confidence index, bankruptcy
filings and the legal and regulatory environment. Generally, due
to the short-term nature of cardmember receivables, the impact
of additional external factors on the losses inherent within the
cardmember receivable portfolio is not significant. As part of this
evaluation process, management also considers various reserve
coverage metrics, such as reserves as a percentage of past due
amounts, reserves as a percentage of cardmember receivables or
loans and net write-off coverage.
Cardmember loans and receivables balances are written off
when management deems amounts to be uncollectible, which is
generally determined by the number of days past due and is
typically no later than 180 days. Cardmember loans and
receivables in bankruptcy or owed by deceased individuals are
written off upon notification. Recoveries are recognized on a
cash basis.
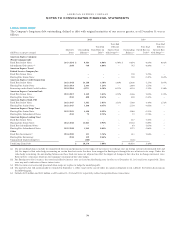
Changes in Cardmember Receivables Reserve for
Losses
The following table presents changes in the cardmember
receivables reserve for losses for the years ended December 31:
(Millions) 2011 2010 2009
Balance, January 1 $ 386 $ 546 $ 810
Additions:
Cardmember receivables provisions(a) 603 439 773
Cardmember receivables provisions –
other(b) 167 156 84
Total provision 770 595 857
Deductions:
Cardmember receivables net write-
offs(c)(d) (560) (598) (1,131)
Cardmember receivables – other(e) (158) (157) 10
Balance, December 31 $ 438 $ 386 $ 546
(a) Represents loss provisions for cardmember receivables consisting of
principal (resulting from authorized transactions) and fee reserve
components.
(b) Primarily represents loss provisions for cardmember receivables resulting
from unauthorized transactions.
(c) Represents write-offs consisting of principal (resulting from authorized
transactions) and fee components, less recoveries of $349 million, $357
million and $349 million for 2011, 2010 and 2009, respectively. For the year
ended December 31, 2009, these amounts also include net write-offs for
cardmember receivables resulting from unauthorized transactions.
(d) Through December 31, 2009, cardmember receivables in the ICS and GCS
segments were written off when 360 days past billing or earlier. During the
first quarter of 2010, consistent with applicable bank regulatory guidance,
the Company modified its methodology to write off cardmember receivables
in the ICS and GCS segments when 180 days past due or earlier. Therefore,
net write-offs for cardmember receivables for the first quarter of 2010
included approximately $108 million resulting from this change in write-off
methodology. The impact of this change to the provision for charge card
losses was not material.
(e) For the years ended December 31, 2011 and 2010, these amounts include net
write-offs related to unauthorized transactions and, for all periods, foreign
currency translation adjustments.
70