American Express 2011 Annual Report Download - page 43
Download and view the complete annual report
Please find page 43 of the 2011 American Express annual report below. You can navigate through the pages in the report by either clicking on the pages listed below, or by using the keyword search tool below to find specific information within the annual report.-
 1
1 -
2
-
3
-
4
-
5
-
6
-
7
-
8
-
9
-
10
-
11
-
12
-
13
-
14
-
15
-
16
-
17
-
18
-
19
-
20
-
21
-
22
-
23
-
24
-
25
-
26
-
27
-
28
-
29
-
30
-
31
-
32
-
 33
33 -
 34
34 -
 35
35 -
 36
36 -
 37
37 -
 38
38 -
 39
39 -
 40
40 -
 41
41 -
 42
42 -
 43
43 -
 44
44 -
 45
45 -
 46
46 -
 47
47 -
 48
48 -
 49
49 -
 50
50 -
 51
51 -
 52
52 -
 53
53 -
54
-
55
-
56
-
57
-
58
-
59
-
60
-
61
-
62
-
63
-
64
-
65
-
66
-
67
-
68
-
69
-
70
-
71
-
72
-
73
-
74
-
75
-
76
-
77
-
78
-
79
-
80
-
81
-
82
-
83
-
84
-
85
-
86
-
87
-
88
-
89
-
90
-
91
-
92
-
93
-
94
-
95
-
96
-
97
-
98
-
99
-
100
-
101
-
102
-
103
-
104
-
105
-
106
-
107
-
108
-
109
-
110
-
111
-
112
-
113
 |
 |

AMERICAN EXPRESS COMPANY
2011 FINANCIAL REVIEW
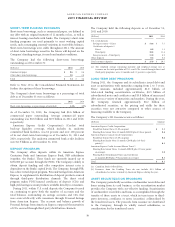
Calculation of Net Interest Yield on Cardmember
Loans
Years Ended December 31,
(Millions, except percentages
and where indicated) 2011 2010 2009
Calculation based on GAAP
information:
Net interest income $ 4,423 $ 4,578 $ 2,648
Average loans (billions) $ 50.3 $ 49.8 $ 25.9
Adjusted net interest income $ 4,490 $ 4,684 $ 2,451
Adjusted average loans (billions) $ 50.3 $ 49.8 $ 26.0
Net interest income divided by
average loans 8.8% 9.2% 10.2%
Net interest yield on cardmember loans 8.9% 9.4% 9.4%
Calculation based on managed
information:
Net interest income $ 4,423 $ 4,578 $ 5,501
Average loans (billions) $ 50.3 $ 49.8 $ 54.9
Adjusted net interest income $ 4,490 $ 4,684 $ 5,558
Adjusted average loans (billions) $ 50.3 $ 49.8 $ 55.0
Net interest yield on cardmember loans 8.9% 9.4% 10.1%
RESULTS OF OPERATIONS FOR THE THREE YEARS
ENDED DECEMBER 31, 2011
The following discussion of USCS segment results of operations
is presented on a GAAP basis.
USCS reported segment income of $2.7 billion for 2011, a $455
million or 20 percent increase from $2.2 billion in 2010, which
increased $1.8 billion or greater than 100 percent from 2009.
Total Revenues Net of Interest Expense
In 2011, USCS total revenues net of interest expense increased
$609 million or 4 percent to $15.1 billion due to increases in
discount revenue, net card fees and other and a decrease in
interest expense, partially offset by decreased interest income.
Discount revenue, net card fees and other of $10.6 billion in
2011 increased $764 million or 8 percent from 2010, primarily
resulting from higher discount revenue, driven by billed business
growth of 12 percent. The growth in billed business was driven
by a 10 percent increase in average spending per proprietary
basic cards-in-force. This line also reflects higher travel
commissions and fees, driven by increased travel sales and was
partially offset by lower other commissions and fees primarily
due to reduced conversion revenue.
Interest income of $5.2 billion in 2011 was $160 million or 3
percent lower than in 2010, principally due to lower yields on
cardmember loans.
Interest expense of $807 million in 2011 decreased $5 million
or 1 percent as compared to a year ago, reflecting reduced cost of
funds, partially offset by increased average cardmember
receivable and loan balances.
Total revenues net of interest expense of $14.5 billion in 2010
were $2.4 billion or 20 percent higher than 2009, primarily as a
result of increases in discount revenue, net card fees and other,
and interest income, partially offset by increased interest
expense.
Provisions for Losses
Provisions for losses decreased $904 million or 57 percent to
$687 million for 2011 compared to 2010, principally reflecting
lower reserve requirements driven by improving cardmember
loan trends, partially offset by higher charge card provision
resulting from higher cardmember receivable balances and a
higher net write-off rate. The lending net write-off rate decreased
to 2.9 percent in 2011 from 5.8 percent in 2010. The charge card
net write-off rate increased to 1.7 percent in 2011 from 1.6
percent in 2010.
Provisions for losses decreased $2.2 billion or 58 percent to
$1.6 billion for 2010 compared to 2009, principally reflecting
lower reserve requirements driven by improving cardmember
loan and charge card credit trends, partially offset by the
inclusion in 2010 of write-offs on securitized cardmember loans
as a result of new GAAP governing consolidations and VIEs and
a higher charge card provision.
Expenses
During 2011, USCS expenses increased $888 million or 9 percent
to $10.3 billion, due to increased marketing, promotion, rewards
and cardmember services expenses, and salaries and employee
benefits and total other operating expenses. Expenses included a
reengineering net benefit of $8 million in 2011, and charges of
$55 million and $12 million in 2010 and 2009, respectively.
Expenses in 2010 of $9.4 billion were $1.6 billion or 21 percent
higher than in 2009, due to increased marketing, promotion,
rewards and cardmember services expenses, and salaries and
employee benefits and total operating expenses.
Marketing, promotion, rewards and cardmember services
expenses increased $849 million or 15 percent in 2011 to $6.6
billion, driven by increased rewards costs, which reflect greater
rewards related spending volumes, higher co-brand expense,
increases in the ultimate redemption rate as the result of
increased customer engagement, and the previously mentioned
increase of the ultimate redemption rate estimate for the U.S.
membership rewards program. Cardmember services expense
also increased as a result of new benefits provided to
cardmembers. These increases were partially offset by lower
marketing and promotion expenses resulting from decreased
product and media spending. Marketing, promotion, rewards
and cardmember services expenses increased $1.4 billion or 32
percent in 2010 to $5.7 billion, due to increased investment
spending resulting from better credit and business trends in 2010
and higher rewards expense primarily due to greater rewards-
related spending volumes and higher co-brand expense.
Salaries and employee benefits and other operating expenses of
$3.7 billion in 2011 increased $39 million or 1 percent from
2010, primarily reflecting increased salary and other employee
benefit costs, offset by reengineering expense in the prior year.
Salaries and employee benefits and other operating expenses of
$3.6 billion in 2010 increased $238 million or 7 percent from
2009, primarily reflecting the higher reengineering-related costs,
and higher technology development expenditures and other
business building investments.
41