American Express 2011 Annual Report Download - page 75
Download and view the complete annual report
Please find page 75 of the 2011 American Express annual report below. You can navigate through the pages in the report by either clicking on the pages listed below, or by using the keyword search tool below to find specific information within the annual report.-
 1
1 -
2
-
3
-
4
-
5
-
6
-
7
-
8
-
9
-
10
-
11
-
12
-
13
-
14
-
15
-
16
-
17
-
18
-
19
-
20
-
21
-
22
-
23
-
24
-
25
-
26
-
27
-
28
-
29
-
30
-
31
-
32
-
33
-
34
-
35
-
36
-
37
-
38
-
39
-
40
-
41
-
42
-
43
-
44
-
45
-
46
-
47
-
48
-
49
-
50
-
51
-
52
-
53
-
54
-
55
-
56
-
57
-
58
-
59
-
60
-
61
-
62
-
63
-
64
-
 65
65 -
 66
66 -
 67
67 -
 68
68 -
 69
69 -
 70
70 -
 71
71 -
 72
72 -
 73
73 -
 74
74 -
 75
75 -
 76
76 -
 77
77 -
 78
78 -
 79
79 -
 80
80 -
 81
81 -
 82
82 -
 83
83 -
 84
84 -
 85
85 -
86
-
87
-
88
-
89
-
90
-
91
-
92
-
93
-
94
-
95
-
96
-
97
-
98
-
99
-
100
-
101
-
102
-
103
-
104
-
105
-
106
-
107
-
108
-
109
-
110
-
111
-
112
-
113
 |
 |

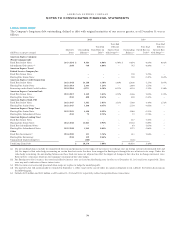
AMERICAN EXPRESS COMPANY
NOTES TO CONSOLIDATED FINANCIAL STATEMENTS
The following table summarizes the gross unrealized losses due to temporary impairments by ratio of fair value to amortized cost as of
December 31:
(Dollars in millions) Less than 12 months 12 months or more Total
Ratio of Fair Value to
Amortized Cost
Number of
Securities
Estimated
Fair Value
Gross
Unrealized
Losses
Number of
Securities
Estimated
Fair Value
Gross
Unrealized
Losses
Number of
Securities
Estimated
Fair Value
Gross
Unrealized
Losses
2011:
90% – 100% – $ – $ – 114 $ 884 $ (35) 114 $ 884 $ (35)
Less than 90% 1 15 (2) 22 212 (38) 23 227 (40)
Total as of December 31, 2011 1 $ 15 $ (2) 136 $ 1,096 $ (73) 137 $ 1,111 $ (75)
2010:
90% – 100% 457 $ 2,554 $ (113) 31 $ 79 $ (7) 488 $ 2,633 $ (120)
Less than 90% 48 351 (46) 115 1,000 (205) 163 1,351 (251)
Total as of December 31, 2010 505 $ 2,905 $ (159) 146 $ 1,079 $ (212) 651 $ 3,984 $ (371)
The gross unrealized losses on state and municipal securities and
all other debt securities can be attributed to higher credit spreads
generally for state and municipal securities, higher credit spreads
for specific issuers, changes in market benchmark interest rates,
or a combination thereof, all as compared to those prevailing
when the investment securities were acquired.
In assessing default risk on these investment securities, the
Company has qualitatively considered the key factors identified
above and determined that it expects to collect all of the
contractual cash flows due on the investment securities.
Overall, for the investment securities in gross unrealized loss
positions identified above, (i) the Company does not intend to
sell the investment securities, (ii) it is more likely than not that
the Company will not be required to sell the investment
securities before recovery of the unrealized losses, and (iii) the
Company expects that the contractual principal and interest will
be received on the investment securities. As a result, the
Company recognized no other-than-temporary impairments
during the periods presented.
SUPPLEMENTAL INFORMATION
Gross realized gains and losses on the sales of investment
securities, included in other non-interest revenues, were as
follows:
(Millions) 2011 2010 2009
Gains $16$ 1 $ 226
Losses –(6) (1)
Total $16$ (5) $ 225
Contractual maturities of investment securities, excluding equity
securities and other securities, as of December 31, 2011 were as
follows:
(Millions) Cost
Estimated
Fair Value
Due within 1 year $ 973 $ 983
Due after 1 year but within 5 years 421 429
Dueafter5yearsbutwithin10years 217 227
Due after 10 years 5,046 5,094
Total $ 6,657 $ 6,733
The expected payments on state and municipal obligations and
mortgage-backed securities may not coincide with their
contractual maturities because the issuers have the right to call
or prepay certain obligations.
73