American Express 2011 Annual Report Download - page 74
Download and view the complete annual report
Please find page 74 of the 2011 American Express annual report below. You can navigate through the pages in the report by either clicking on the pages listed below, or by using the keyword search tool below to find specific information within the annual report.-
 1
1 -
2
-
3
-
4
-
5
-
6
-
7
-
8
-
9
-
10
-
11
-
12
-
13
-
14
-
15
-
16
-
17
-
18
-
19
-
20
-
21
-
22
-
23
-
24
-
25
-
26
-
27
-
28
-
29
-
30
-
31
-
32
-
33
-
34
-
35
-
36
-
37
-
38
-
39
-
40
-
41
-
42
-
43
-
44
-
45
-
46
-
47
-
48
-
49
-
50
-
51
-
52
-
53
-
54
-
55
-
56
-
57
-
58
-
59
-
60
-
61
-
62
-
63
-
 64
64 -
 65
65 -
 66
66 -
 67
67 -
 68
68 -
 69
69 -
 70
70 -
 71
71 -
 72
72 -
 73
73 -
 74
74 -
 75
75 -
 76
76 -
 77
77 -
 78
78 -
 79
79 -
 80
80 -
 81
81 -
 82
82 -
 83
83 -
 84
84 -
85
-
86
-
87
-
88
-
89
-
90
-
91
-
92
-
93
-
94
-
95
-
96
-
97
-
98
-
99
-
100
-
101
-
102
-
103
-
104
-
105
-
106
-
107
-
108
-
109
-
110
-
111
-
112
-
113
 |
 |

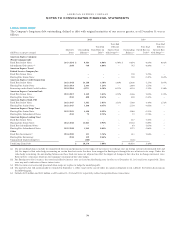
AMERICAN EXPRESS COMPANY
NOTES TO CONSOLIDATED FINANCIAL STATEMENTS
NOTE 6
INVESTMENT SECURITIES
Investment securities include debt and equity securities and are
classified as available for sale. The Company’s investment
securities, principally debt securities, are carried at fair value on
the Consolidated Balance Sheets with unrealized gains (losses)
recorded in AOCI, net of income tax provisions (benefits).
Realized gains and losses are recognized in results of operations
upon disposition of the securities using the specific identification
method on a trade date basis. Refer to Note 3 for a description of
the Company’s methodology for determining the fair value of its
investment securities.
The following is a summary of investment securities as of December 31:
2011 2010
(Millions) Cost
Gross
Unrealized
Gains
Gross
Unrealized
Losses
Estimated
Fair
Value Cost
Gross
Unrealized
Gains
Gross
Unrealized
Losses
Estimated
Fair
Value
State and municipal obligations $ 4,968 $ 103 $ (72) $ 4,999 $ 6,140 $ 24 $ (367) $ 5,797
U.S. Government agency obligations 352 2 – 354 3,402 12 (1) 3,413
U.S. Government treasury obligations 330 10 – 340 2,450 6 – 2,456
Corporate debt securities(a) 626 9 (3) 632 1,431 15 (1) 1,445
Mortgage-backed securities(b) 261 17 – 278 272 6 (2) 276
Equity securities(c) 95 265 – 360 98 377 – 475
Foreign government bonds and obligations 120 10 – 130 95 4 – 99
Other 54 – – 54 49––49
Total $ 6,806 $ 416 $ (75) $ 7,147 $ 13,937 $ 444 $ (371) $ 14,010
(a) The December 31, 2011 and 2010 balances include, on a cost basis, $0.6 billion and $1.3 billion, respectively, of corporate debt obligations issuedunderthe
Temporary Liquidity Guarantee Program (TLGP) that are guaranteed by the Federal Deposit Insurance Corporation (FDIC).
(b) Represents mortgage-backed securities guaranteed by Fannie Mae, Freddie Mac or Ginnie Mae.
(c) Primarily represents the Company’s investment in the Industrial and Commercial Bank of China (ICBC).
OTHER-THAN-TEMPORARY IMPAIRMENT
Realized losses are recognized upon management’s
determination that a decline in fair value is other than
temporary. The determination of other-than-temporary
impairment is a subjective process, requiring the use of
judgments and assumptions regarding the amount and timing of
recovery. The Company reviews and evaluates its investments at
least quarterly and more often, as market conditions may
require, to identify investments that have indications of other-
than-temporary impairments. It is reasonably possible that a
change in estimate could occur in the near term relating to
other-than-temporary impairment. Accordingly, the Company
considers several factors when evaluating debt securities for
other-than-temporary impairment including the determination
of the extent to which the decline in fair value of the security is
due to increased default risk for the specific issuer or market
interest rate risk. With respect to increased default risk, the
Company assesses the collectibility of principal and interest
payments by monitoring issuers’ credit ratings, related changes
to those ratings, specific credit events associated with the
individualissuersaswellasthecreditratingsofafinancial
guarantor, where applicable, and the extent to which amortized
cost exceeds fair value and the duration and size of that
difference. With respect to market interest rate risk, including
benchmark interest rates and credit spreads, the Company
assesses whether it has the intent to sell the securities and
whether it is more likely than not that the Company will not be
required to sell the securities before recovery of any unrealized
losses.
The following table provides information about the Company’s investment securities with gross unrealized losses and the length of time
that individual securities have been in a continuous unrealized loss position as of December 31:
2011 2010
(Millions) Less than 12 months 12 months or more Less than 12 months 12 months or more
Description of Securities
Estimated
Fair Value
Gross
Unrealized
Losses
Estimated
Fair Value
Gross
Unrealized
Losses
Estimated
Fair Value
Gross
Unrealized
Losses
Estimated
Fair Value
Gross
Unrealized
Losses
State and municipal obligations $ – $ – $ 1,094 $ (72) $ 2,535 $ (156) $ 1,076 $ (211)
U.S. Government agency obligations ––––299 (1) – –
Corporate debt securities 15 (2) 2 (1) ––3(1)
Mortgage-backed securities ––––71 (2) – –
Total $ 15 $ (2) $ 1,096 $ (73) $ 2,905 $ (159) $ 1,079 $ (212)
72