American Express 2011 Annual Report Download - page 90
Download and view the complete annual report
Please find page 90 of the 2011 American Express annual report below. You can navigate through the pages in the report by either clicking on the pages listed below, or by using the keyword search tool below to find specific information within the annual report.-
 1
1 -
2
-
3
-
4
-
5
-
6
-
7
-
8
-
9
-
10
-
11
-
12
-
13
-
14
-
15
-
16
-
17
-
18
-
19
-
20
-
21
-
22
-
23
-
24
-
25
-
26
-
27
-
28
-
29
-
30
-
31
-
32
-
33
-
34
-
35
-
36
-
37
-
38
-
39
-
40
-
41
-
42
-
43
-
44
-
45
-
46
-
47
-
48
-
49
-
50
-
51
-
52
-
53
-
54
-
55
-
56
-
57
-
58
-
59
-
60
-
61
-
62
-
63
-
64
-
65
-
66
-
67
-
68
-
69
-
70
-
71
-
72
-
73
-
74
-
75
-
76
-
77
-
78
-
79
-
 80
80 -
 81
81 -
 82
82 -
 83
83 -
 84
84 -
 85
85 -
 86
86 -
 87
87 -
 88
88 -
 89
89 -
 90
90 -
 91
91 -
 92
92 -
 93
93 -
 94
94 -
 95
95 -
 96
96 -
 97
97 -
 98
98 -
 99
99 -
 100
100 -
101
-
102
-
103
-
104
-
105
-
106
-
107
-
108
-
109
-
110
-
111
-
112
-
113
 |
 |

AMERICAN EXPRESS COMPANY
NOTES TO CONSOLIDATED FINANCIAL STATEMENTS
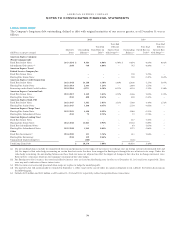
The following table summarizes the Company’s restructuring charges, net of revisions, by reportable operating segment and
Corporate & Other for the year ended December 31, 2011, and the cumulative amounts relating to the restructuring programs that were
in progress during 2011 and initiated at various dates between 2008 and 2011.
2011
Cumulative Restructuring Expense Incurred To Date On
In-Progress Restructuring Programs
(Millions)
Total Restructuring
Charges, net of
revisions Severance Other Total
USCS $ (10) $ 58$ 6$ 64
ICS 29 84 2 86
GCS 37 239 18 257
GNMS (1) 30 9 39
Corporate & Other 64 72 40 112(a)
Total $ 119 $ 483 $ 75 $ 558(b)
(a) Corporate & Other includes certain severance and other charges of $108 million, related to Company-wide support functions which were not allocated to the
Company’s reportable operating segments, as these were corporate initiatives, which is consistent with how such charges were reported internally.
(b) As of December 31, 2011, the total expenses to be incurred for previously approved restructuring activities that were in progress are not expected to be materially
different than the cumulative expenses incurred to date for these programs, except for those 2012 charges noted above.
NOTE 17
INCOME TAXES
The components of income tax expense for the years ended
December 31 included in the Consolidated Statements of Income
were as follows:
(Millions) 2011 2010 2009
Current income tax expense:
U.S. federal $ 958 $ 532 $ 661
U.S. state and local 156 110 40
Non-U.S. 434 508 295
Total current income tax expense 1,548 1,150 996
Deferred income tax expense (benefit):
U.S. federal 464 782 (231)
U.S. state and local 68 78 24
Non-U.S. (23) (103) (85)
Total deferred income tax expense
(benefit) 509 757 (292)
Total income tax expense on continuing
operations $ 2,057 $ 1,907 $ 704
Income tax (benefit) expense from
discontinued operations $ (36) $–$4
A reconciliation of the U.S. federal statutory rate of 35 percent to
the Company’s actual income tax rate for the years ended
December 31 on continuing operations was as follows:
2011 2010 2009
Combined tax at U.S. statutory federal
income tax rate 35.0% 35.0% 35.0%
Increase (decrease) in taxes resulting from:
Tax-exempt income (1.5) (1.9) (4.6)
State and local income taxes, net of
federal benefit 2.6 2.7 2.7
Non-U.S. subsidiaries earnings(a) (4.4) (3.1) (6.8)
Tax settlements(b) (1.9) (1.3) (1.4)
All other (0.2) 0.6 (0.1)
Actual tax rates 29.6% 32.0% 24.8%
(a) Results for all years primarily include tax benefits associated with the
undistributed earnings of certain non-U.S. subsidiaries that were deemed to
be reinvested indefinitely.
(b) Relates to the resolution of tax matters in various jurisdictions.
The Company records a deferred income tax (benefit) provision
when there are differences between assets and liabilities
measured for financial reporting and for income tax return
purposes. These temporary differences result in taxable or
deductible amounts in future years and are measured using the
tax rates and laws that will be in effect when such differences are
expected to reverse.
The significant components of deferred tax assets and liabilities
as of December 31 are reflected in the following table:
(Millions) 2011 2010
Deferred tax assets:
Reserves not yet deducted for tax purposes $ 3,435 $ 3,789
Employee compensation and benefits 760 741
Other 626 290
Gross deferred tax assets 4,821 4,820
Valuation allowance (112) (104)
Deferred tax assets after valuation allowance 4,709 4,716
Deferred tax liabilities:
Intangibles and fixed assets 1,013 834
Deferred revenue 382 36
Asset securitizations 39 43
Net unrealized securities gains 25 19
Other 375 387
Gross deferred tax liabilities 1,834 1,319
Net deferred tax assets $ 2,875 $ 3,397
A valuation allowance is established when management
determines that it is more likely than not that all or some portion
of the benefit of the deferred tax assets will not be realized. The
valuation allowances as of December 31, 2011 and 2010 are
associated with net operating losses and other deferred tax assets
in certain non-U.S. operations of the Company.
Accumulated earnings of certain non-U.S. subsidiaries, which
totaled approximately $7.7 billion as of December 31, 2011, are
intended to be permanently reinvested outside the United States.
The Company does not provide for federal income taxes on
88