American Express 2011 Annual Report Download - page 78
Download and view the complete annual report
Please find page 78 of the 2011 American Express annual report below. You can navigate through the pages in the report by either clicking on the pages listed below, or by using the keyword search tool below to find specific information within the annual report.-
 1
1 -
2
-
3
-
4
-
5
-
6
-
7
-
8
-
9
-
10
-
11
-
12
-
13
-
14
-
15
-
16
-
17
-
18
-
19
-
20
-
21
-
22
-
23
-
24
-
25
-
26
-
27
-
28
-
29
-
30
-
31
-
32
-
33
-
34
-
35
-
36
-
37
-
38
-
39
-
40
-
41
-
42
-
43
-
44
-
45
-
46
-
47
-
48
-
49
-
50
-
51
-
52
-
53
-
54
-
55
-
56
-
57
-
58
-
59
-
60
-
61
-
62
-
63
-
64
-
65
-
66
-
67
-
 68
68 -
 69
69 -
 70
70 -
 71
71 -
 72
72 -
 73
73 -
 74
74 -
 75
75 -
 76
76 -
 77
77 -
 78
78 -
 79
79 -
 80
80 -
 81
81 -
 82
82 -
 83
83 -
 84
84 -
 85
85 -
 86
86 -
 87
87 -
 88
88 -
89
-
90
-
91
-
92
-
93
-
94
-
95
-
96
-
97
-
98
-
99
-
100
-
101
-
102
-
103
-
104
-
105
-
106
-
107
-
108
-
109
-
110
-
111
-
112
-
113
 |
 |

AMERICAN EXPRESS COMPANY
NOTES TO CONSOLIDATED FINANCIAL STATEMENTS
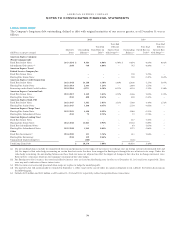
The components of other intangible assets were as follows:
2011 2010
(Millions)
Gross Carrying
Amount
Accumulated
Amortization
Net Carrying
Amount
Gross Carrying
Amount
Accumulated
Amortization
Net Carrying
Amount
Customer relationships(a) $ 1,223 $ (407) $ 816 $ 1,125 $ (332) $ 793
Other 445 (112) 333 262 (83) 179
Total $ 1,668 $ (519) $ 1,149 $ 1,387 $ (415) $ 972
(a) Includes intangibles acquired from airline partners of $410 million and $478 million as of December 31, 2011 and 2010, respectively, including approximately $195
million and $230 million, respectively, from Delta.
Amortization expense for the years ended December 31, 2011, 2010 and 2009 was $189 million, $176 million and $140 million,
respectively. Intangible assets acquired in 2011 and 2010 are being amortized, on average, over 13 years and 8 years, respectively.
Estimated amortization expense for other intangible assets over the next five years is as follows:
(Millions) 2012 2013 2014 2015 2016
Estimated amortization expense $ 200 $ 190 $ 165 $ 146 $ 120
OTHER
The Company had $332 million and $197 million in affordable
housing partnership interests as of December 31, 2011 and 2010,
respectively, included in other assets in the table above.
The Company is a limited partner and typically has a less than 50
percent interest in the affordable housing partnerships. These
partnership interests are accounted for in accordance with GAAP
governing equity method investments and joint ventures.
NOTE 9
CUSTOMER DEPOSITS
As of December 31, customer deposits were categorized as
interest-bearing or non-interest-bearing deposits as follows:
(Millions) 2011 2010
U.S.:
Interest-bearing $ 37,271 $ 29,053
Non-interest-bearing 417
Non-U.S.:
Interest-bearing 612 640
Non-interest-bearing 11 17
Total customer deposits $ 37,898 $ 29,727
Customer deposits were aggregated by deposit type offered by
the Company as of December 31 as follows:
(Millions) 2011 2010
U.S. retail deposits:
Savings accounts – Direct $ 14,649 $ 7,725
Certificates of deposit:
Direct 893 1,052
Third party 10,781 11,411
Sweep accounts – Third party 10,948 8,865
Other deposits 627 674
Total customer deposits $ 37,898 $ 29,727
The scheduled maturities of all certificates of deposit as of
December 31, 2011 were as follows:
(Millions) U.S. Non-U.S. Total
2012 $ 3,317 $ 386 $ 3,703
2013 4,820 1 4,821
2014 2,441 – 2,441
2015 267 – 267
2016 607 – 607
After 5 years 222 – 222
Total $ 11,674 $ 387 $ 12,061
As of December 31, certificates of deposit in denominations of
$100,000 or more were as follows:
(Millions) 2011 2010
U.S. $ 580 $ 689
Non-U.S. 304 291
Total $ 884 $ 980
76