Best Buy 2013 Annual Report Download - page 100
Download and view the complete annual report
Please find page 100 of the 2013 Best Buy annual report below. You can navigate through the pages in the report by either clicking on the pages listed below, or by using the keyword search tool below to find specific information within the annual report.-
 1
1 -
2
-
3
-
4
-
5
-
6
-
7
-
8
-
9
-
10
-
11
-
12
-
13
-
14
-
15
-
16
-
17
-
18
-
19
-
20
-
21
-
22
-
23
-
24
-
25
-
26
-
27
-
28
-
29
-
30
-
31
-
32
-
33
-
34
-
35
-
36
-
37
-
38
-
39
-
40
-
41
-
42
-
43
-
44
-
45
-
46
-
47
-
48
-
49
-
50
-
51
-
52
-
53
-
54
-
55
-
56
-
57
-
58
-
59
-
60
-
61
-
62
-
63
-
64
-
65
-
66
-
67
-
68
-
69
-
70
-
71
-
72
-
73
-
74
-
75
-
76
-
77
-
78
-
79
-
80
-
81
-
82
-
83
-
84
-
85
-
86
-
87
-
88
-
89
-
 90
90 -
 91
91 -
 92
92 -
 93
93 -
 94
94 -
 95
95 -
 96
96 -
 97
97 -
 98
98 -
 99
99 -
 100
100 -
 101
101 -
 102
102 -
 103
103 -
 104
104 -
 105
105 -
 106
106 -
 107
107 -
 108
108 -
 109
109 -
 110
110 -
111
-
112
-
113
-
114
-
115
-
116
 |
 |

100
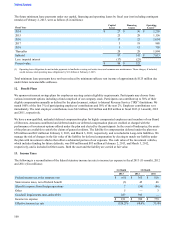
The future minimum lease payments under our capital, financing and operating leases by fiscal year (not including contingent
rentals) at February 2, 2013, were as follows ($ in millions):
Fiscal Year Capital
Leases Financing
Leases Operating
Leases(1)
2014 $ 27 $ 30 $ 1,238
2015 25 28 1,156
2016 17 25 1,034
2017 5 19 888
2018 3 15 703
Thereafter 20 28 1,994
Subtotal 97 145 $ 7,013
Less: imputed interest (17)(23)
Present value $ 80 $ 122
(1) Operating lease obligations do not include payments to landlords covering real estate taxes and common area maintenance. These charges, if included,
would increase total operating lease obligations by $1.6 billion at February 2, 2013.
Total minimum lease payments have not been reduced by minimum sublease rent income of approximately $125 million due
under future noncancelable subleases.
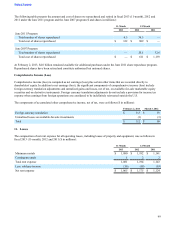
12. Benefit Plans
We sponsor retirement savings plans for employees meeting certain eligibility requirements. Participants may choose from
various investment options including a fund comprised of our company stock. Participants can contribute up to 50% of their
eligible compensation annually as defined by the plan document, subject to Internal Revenue Service ("IRS") limitations. We
match 100% of the first 3% of participating employees' contributions and 50% of the next 2%. Employer contributions vest
immediately. The total employer contributions were $62 million, $69 million and $69 million in fiscal 2013 (11-month), 2012
and 2011, respectively.
We have a non-qualified, unfunded deferred compensation plan for highly compensated employees and members of our Board
of Directors. Amounts contributed and deferred under our deferred compensation plan are credited or charged with the
performance of investment options offered under the plan and elected by the participants. In the event of bankruptcy, the assets
of the plan are available to satisfy the claims of general creditors. The liability for compensation deferred under the plan was
$58 million and $62 million at February 2, 2013, and March 3, 2012, respectively, and is included in Long-term liabilities. We
manage the risk of changes in the fair value of the liability for deferred compensation by electing to match our liability under
the plan with investment vehicles that offset a substantial portion of our exposure. The cash value of the investment vehicles,
which includes funding for future deferrals, was $88 million and $83 million at February 2, 2013, and March 3, 2012,
respectively, and is included in Other assets. Both the asset and the liability are carried at fair value.
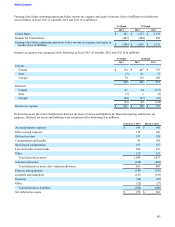
13. Income Taxes
The following is a reconciliation of the federal statutory income tax rate to income tax expense in fiscal 2013 (11-month), 2012
and 2011 ($ in millions):
11-Month 12-Month
2013 2012 2011
Federal income tax at the statutory rate $ (65) $ 365 $ 816
State income taxes, net of federal benefit (3) 45 46
(Benefit) expense from foreign operations 7 (96)(86)
Other 5 — 3
Goodwill impairments (non-deductible) 287 395 —
Income tax expense $ 231 $ 709 $ 779
Effective income tax rate (124.2)% 68.0% 33.4%
Table of Contents