Best Buy 2013 Annual Report Download - page 103
Download and view the complete annual report
Please find page 103 of the 2013 Best Buy annual report below. You can navigate through the pages in the report by either clicking on the pages listed below, or by using the keyword search tool below to find specific information within the annual report.-
 1
1 -
2
-
3
-
4
-
5
-
6
-
7
-
8
-
9
-
10
-
11
-
12
-
13
-
14
-
15
-
16
-
17
-
18
-
19
-
20
-
21
-
22
-
23
-
24
-
25
-
26
-
27
-
28
-
29
-
30
-
31
-
32
-
33
-
34
-
35
-
36
-
37
-
38
-
39
-
40
-
41
-
42
-
43
-
44
-
45
-
46
-
47
-
48
-
49
-
50
-
51
-
52
-
53
-
54
-
55
-
56
-
57
-
58
-
59
-
60
-
61
-
62
-
63
-
64
-
65
-
66
-
67
-
68
-
69
-
70
-
71
-
72
-
73
-
74
-
75
-
76
-
77
-
78
-
79
-
80
-
81
-
82
-
83
-
84
-
85
-
86
-
87
-
88
-
89
-
90
-
91
-
92
-
 93
93 -
 94
94 -
 95
95 -
 96
96 -
 97
97 -
 98
98 -
 99
99 -
 100
100 -
 101
101 -
 102
102 -
 103
103 -
 104
104 -
 105
105 -
 106
106 -
 107
107 -
 108
108 -
 109
109 -
 110
110 -
 111
111 -
 112
112 -
 113
113 -
114
-
115
-
116
 |
 |

103
14. Segment and Geographic Information
Segment Information
Our chief operating decision maker ("CODM") is our Chief Executive Officer. Our business is organized into two segments:
Domestic (which is comprised of all operations within the U.S. and its territories) and International (which is comprised of all
operations outside the U.S. and its territories). Our CODM has ultimate responsibility for enterprise decisions. Our CODM
determines, in particular, resource allocation for, and monitors performance of, the consolidated enterprise, the Domestic
segment and the International segment. Segment managers for the Domestic segment and the International segment have
responsibility for operating decisions, allocating resources and assessing performance within their respective segments. Our
CODM relies on internal management reporting that analyzes enterprise and segment results to the operating income level.
We do not aggregate our operating segments, so our operating segments also represent our reportable segments. The accounting
policies of the segments are the same as those described in Note 1, Summary of Significant Accounting Policies.
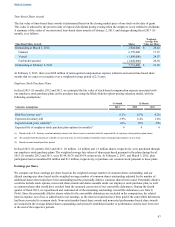
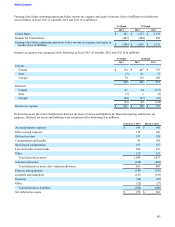
The following tables present our business segment information in fiscal 2013 (11-month), 2012 and 2011 ($ in millions):
11-Month 12-Month
2013 2012 2011
Revenue
Domestic $ 33,343 $ 37,615 $ 37,070
International 11,742 13,090 12,677
Total revenue $ 45,085 $ 50,705 $ 49,747
Percentage of revenue, by revenue category
Domestic:
Consumer Electronics 33% 36% 37%
Computing and Mobile Phones 44% 40% 37%
Entertainment 10% 12% 14%
Appliances 6% 5% 5%
Services 6% 6% 6%
Other 1% 1% 1%
Total 100% 100% 100%
International:
Consumer Electronics 18% 20% 20%
Computing and Mobile Phones 61% 56% 55%
Entertainment 4% 5% 6%
Appliances 10% 10% 9%
Services 7% 9% 10%
Other < 1% < 1% < 1%
Total 100% 100% 100%
Table of Contents