Best Buy 2013 Annual Report Download - page 76
Download and view the complete annual report
Please find page 76 of the 2013 Best Buy annual report below. You can navigate through the pages in the report by either clicking on the pages listed below, or by using the keyword search tool below to find specific information within the annual report.-
 1
1 -
2
-
3
-
4
-
5
-
6
-
7
-
8
-
9
-
10
-
11
-
12
-
13
-
14
-
15
-
16
-
17
-
18
-
19
-
20
-
21
-
22
-
23
-
24
-
25
-
26
-
27
-
28
-
29
-
30
-
31
-
32
-
33
-
34
-
35
-
36
-
37
-
38
-
39
-
40
-
41
-
42
-
43
-
44
-
45
-
46
-
47
-
48
-
49
-
50
-
51
-
52
-
53
-
54
-
55
-
56
-
57
-
58
-
59
-
60
-
61
-
62
-
63
-
64
-
65
-
 66
66 -
 67
67 -
 68
68 -
 69
69 -
 70
70 -
 71
71 -
 72
72 -
 73
73 -
 74
74 -
 75
75 -
 76
76 -
 77
77 -
 78
78 -
 79
79 -
 80
80 -
 81
81 -
 82
82 -
 83
83 -
 84
84 -
 85
85 -
 86
86 -
87
-
88
-
89
-
90
-
91
-
92
-
93
-
94
-
95
-
96
-
97
-
98
-
99
-
100
-
101
-
102
-
103
-
104
-
105
-
106
-
107
-
108
-
109
-
110
-
111
-
112
-
113
-
114
-
115
-
116
 |
 |

76
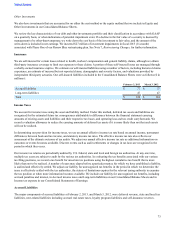
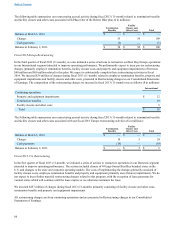
We recognize revenue when: (i) a certificate is redeemed by the customer, (ii) a certificate expires or (iii) the likelihood of a
certificate being redeemed by a customer is remote ("certificate breakage"). We determine our certificate breakage rate based
upon historical redemption patterns.
Cost of Goods Sold and Selling, General and Administrative Expenses
The following table illustrates the primary costs classified in each major expense category:
Cost of Goods Sold
• Total cost of products sold including:
— Freight expenses associated with moving merchandise inventories from our vendors to our distribution centers;
— Vendor allowances that are not a reimbursement of specific, incremental and identifiable costs to promote a
vendor's products; and
— Cash discounts on payments to merchandise vendors;
• Cost of services provided including:
— Payroll and benefits costs for services employees; and
— Cost of replacement parts and related freight expenses;
• Physical inventory losses;
• Markdowns;
• Customer shipping and handling expenses;
• Costs associated with operating our distribution network, including payroll and benefit costs, occupancy costs, and
depreciation; and
• Freight expenses associated with moving merchandise inventories from our distribution centers to our retail stores.
SG&A
• Payroll and benefit costs for retail and corporate employees;
• Occupancy and maintenance costs of retail, services and corporate facilities;
• Depreciation and amortization related to retail, services and corporate assets;
• Advertising costs;
• Vendor allowances that are a reimbursement of specific, incremental and identifiable costs to promote a vendor's
products;
• Tender costs, including bank charges and costs associated with credit and debit card interchange fees;
• Charitable contributions;
• Outside and outsourced service fees;
• Long-lived asset impairment charges; and
• Other administrative costs, such as supplies, and travel and lodging.
Vendor Allowances
We receive funds from vendors for various programs, primarily as reimbursements for costs such as markdowns, margin
protection, advertising and sales incentives.
Vendor allowances provided as a reimbursement of specific, incremental and identifiable costs incurred to promote a vendor's
products are included in SG&A as an expense reduction when the cost is incurred. All other vendor allowances are generally in
the form of receipt-based funds or sell-through credits. Receipt-based funds are generally determined based on our level of
inventory purchases and initially deferred and recorded as a reduction of merchandise inventories. The deferred amounts are
then included as a reduction of cost of goods sold when the related product is sold. Sell-through credits are generally based on
the number of units we sell over a specified period and are recognized when the related product is sold.
Advertising Costs
Advertising costs, which are included in SG&A, are expensed the first time the advertisement runs. Advertising costs consist
primarily of print and television advertisements as well as promotional events. Net advertising expenses were $913 million,
$995 million and $862 million in fiscal 2013 (11-month), 2012 and 2011, respectively.
Table of Contents