Best Buy 2013 Annual Report Download - page 95
Download and view the complete annual report
Please find page 95 of the 2013 Best Buy annual report below. You can navigate through the pages in the report by either clicking on the pages listed below, or by using the keyword search tool below to find specific information within the annual report.-
 1
1 -
2
-
3
-
4
-
5
-
6
-
7
-
8
-
9
-
10
-
11
-
12
-
13
-
14
-
15
-
16
-
17
-
18
-
19
-
20
-
21
-
22
-
23
-
24
-
25
-
26
-
27
-
28
-
29
-
30
-
31
-
32
-
33
-
34
-
35
-
36
-
37
-
38
-
39
-
40
-
41
-
42
-
43
-
44
-
45
-
46
-
47
-
48
-
49
-
50
-
51
-
52
-
53
-
54
-
55
-
56
-
57
-
58
-
59
-
60
-
61
-
62
-
63
-
64
-
65
-
66
-
67
-
68
-
69
-
70
-
71
-
72
-
73
-
74
-
75
-
76
-
77
-
78
-
79
-
80
-
81
-
82
-
83
-
84
-
 85
85 -
 86
86 -
 87
87 -
 88
88 -
 89
89 -
 90
90 -
 91
91 -
 92
92 -
 93
93 -
 94
94 -
 95
95 -
 96
96 -
 97
97 -
 98
98 -
 99
99 -
 100
100 -
 101
101 -
 102
102 -
 103
103 -
 104
104 -
 105
105 -
106
-
107
-
108
-
109
-
110
-
111
-
112
-
113
-
114
-
115
-
116
 |
 |

95
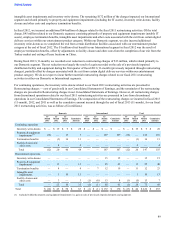
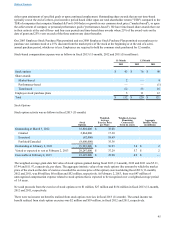
either upon attainment of specified goals or upon continued employment. Outstanding share awards that are not time-based
typically vest at the end of a three-year incentive period based either upon our total shareholder return ("TSR") compared to the
TSR of companies that comprise Standard & Poor's 500 Index or growth in our common stock price ("market-based"), or upon
the achievement of company or personal performance goals ("performance-based"). We have time-based share awards that vest
in their entirety at the end of three- and four-year periods and time-based share awards where 25% of the award vests on the
date of grant and 25% vests on each of the three anniversary dates thereafter.
Our 2003 Employee Stock Purchase Plan permitted and our 2008 Employee Stock Purchase Plan permitted our employees to
purchase our common stock at a 15% discount from the market price of the stock at the beginning or at the end of a semi-
annual purchase period, whichever is less. Employees are required to hold the common stock purchased for 12 months.
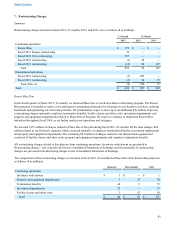
Stock-based compensation expense was as follows in fiscal 2013 (11-month), 2012 and 2011 ($ in millions):
11-Month 12-Month
2013 2012 2011
Stock options $ 43 $ 76 $ 90
Share awards
Market-based 2 — 4
Performance-based — — (1)
Time-based 62 33 16
Employee stock purchase plans 5 11 12
Total $ 112 $ 120 $ 121
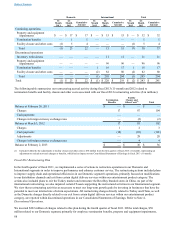
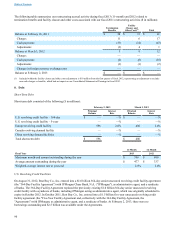
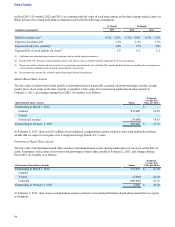
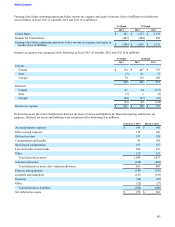
Stock Options
Stock option activity was as follows in fiscal 2013 (11-month):
Stock
Options
Weighted-
Average
Exercise Price
per Share
Weighted-Average
Remaining
Contractual
Term (in years)
Aggregate
Intrinsic Value
(in millions)
Outstanding at March 3, 2012 35,801,000 $ 38.08
Granted 2,864,000 17.30
Exercised (82,000) 18.69
Forfeited/Canceled (8,600,000) 35.36
Outstanding at February 2, 2013 29,983,000 $ 36.93 5.8 $ 2
Vested or expected to vest at February 2, 2013 29,247,000 $ 37.29 5.7 $ 2
Exercisable at February 2, 2013 22,629,000 $ 39.98 4.9 $ —
The weighted-average grant-date fair value of stock options granted during fiscal 2013 (11-month), 2012 and 2011 was $5.11,
$7.94 and $11.97, respectively, per share. The aggregate intrinsic value of our stock options (the amount by which the market
price of the stock on the date of exercise exceeded the exercise price of the option) exercised during fiscal 2013 (11-month),
2012 and 2011, was $0 million, $6 million and $52 million, respectively. At February 2, 2013, there was $47 million of
unrecognized compensation expense related to stock options that is expected to be recognized over a weighted-average period
of 1.4 years.
Net cash proceeds from the exercise of stock options were $1 million, $27 million and $134 million in fiscal 2013 (11-month),
2012 and 2011, respectively.
There were no income tax benefits realized from stock option exercises in fiscal 2013 (11-month). The actual income tax
benefit realized from stock option exercises was $2 million and $19 million, in fiscal 2012 and 2011, respectively.
Table of Contents