Best Buy 2013 Annual Report Download - page 48
Download and view the complete annual report
Please find page 48 of the 2013 Best Buy annual report below. You can navigate through the pages in the report by either clicking on the pages listed below, or by using the keyword search tool below to find specific information within the annual report.-
 1
1 -
2
-
3
-
4
-
5
-
6
-
7
-
8
-
9
-
10
-
11
-
12
-
13
-
14
-
15
-
16
-
17
-
18
-
19
-
20
-
21
-
22
-
23
-
24
-
25
-
26
-
27
-
28
-
29
-
30
-
31
-
32
-
33
-
34
-
35
-
36
-
37
-
 38
38 -
 39
39 -
 40
40 -
 41
41 -
 42
42 -
 43
43 -
 44
44 -
 45
45 -
 46
46 -
 47
47 -
 48
48 -
 49
49 -
 50
50 -
 51
51 -
 52
52 -
 53
53 -
 54
54 -
 55
55 -
 56
56 -
 57
57 -
 58
58 -
59
-
60
-
61
-
62
-
63
-
64
-
65
-
66
-
67
-
68
-
69
-
70
-
71
-
72
-
73
-
74
-
75
-
76
-
77
-
78
-
79
-
80
-
81
-
82
-
83
-
84
-
85
-
86
-
87
-
88
-
89
-
90
-
91
-
92
-
93
-
94
-
95
-
96
-
97
-
98
-
99
-
100
-
101
-
102
-
103
-
104
-
105
-
106
-
107
-
108
-
109
-
110
-
111
-
112
-
113
-
114
-
115
-
116
 |
 |

48
Auction Rate Securities and Restricted Cash
At February 2, 2013, and March 3, 2012, we had $21 million and $82 million, respectively, invested in ARS recorded at fair
value within Equity and other investments (long-term) in our Consolidated Balance Sheets. The majority of our ARS portfolio
is AA/Aaa-rated and collateralized by student loans, which are guaranteed 95% to 100% by the U.S. government. Due to the
auction failures that began in February 2008, we have been unable to liquidate a portion of our ARS. The investment principal
associated with our remaining ARS subject to failed auctions will not be accessible until successful auctions occur, a buyer is
found outside of the auction process, the issuers establish a different form of financing to replace these securities or final
payments are due according to the contractual maturities of the debt issues, which range from 10 to 29 years. We do not intend
to sell our remaining ARS until we can recover the full principal amount through one of the means described above. In
addition, we do not believe it is more likely than not we would be required to sell our remaining ARS until we can recover the
full principal amount based on our other sources of liquidity.
Our liquidity is also affected by restricted cash balances that are pledged as collateral or restricted to use for vendor payables,
general liability insurance, workers' compensation insurance and customer warranty and insurance programs. Restricted cash
and cash equivalents, which are included in other current assets, were $363 million and $459 million at February 2, 2013, and
March 3, 2012, respectively.
Capital Expenditures
Our capital expenditures typically include investments in new stores, store remodeling, store relocations and expansions,
distribution facilities and information technology enhancements. During fiscal 2013 (11-month), we invested $705 million in
property and equipment, including opening new stores (primarily small-format), remodeling certain stores, and upgrading our
information technology systems and capabilities.
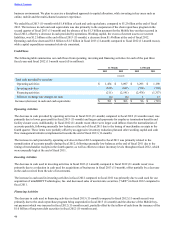
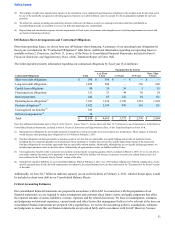
The following table presents our capital expenditures for each of the past three fiscal years and fiscal 2012 (11-month recast) ($
in millions):
11-Month 12-Month
2013 2012 2012 2011
(recast)
New stores $ 111 $ 170 $ 171 $ 193
Store-related projects(1) 149 223 231 208
Information technology 394 274 353 327
Other 51 42 11 16
Total capital expenditures(2) $ 705 $ 709 $ 766 $ 744
(1) Includes store remodels and expansions, as well as various merchandising projects.
(2) Total capital expenditures exclude non-cash capital expenditures of $29 million, $13 million, $18 million and $81 million for fiscal 2013 (11-month),
2012 (11-month recast), 2012, and 2011, respectively. Non-cash capital expenditures are comprised of capitalized leases, as well as additions to property
and equipment included in accounts payable.
Refer to Note 15, Contingencies and Commitments, of the Notes to Consolidated Financial Statements, included in Item 8,
Financial Statements and Supplementary Data, of this Transition Report on Form 10-K for further information regarding our
significant commitments for capital expenditures at February 2, 2013.
Debt and Capital
2013 Notes
In June 2008, we sold $500 million principal amount of notes due July 15, 2013 (the "2013 Notes"). Prior to August 6, 2012,
the 2013 Notes bore interest at a fixed rate of 6.75% per year. The interest payable on the 2013 Notes is subject to adjustment if
either Moody's or Standard & Poor's downgrades the rating assigned to the 2013 Notes to below investment grade. As a result
of credit downgrades by Standard & Poor's on August 6, 2012 and November 21, 2012, the 2013 Notes bore interest at a fixed
rate of 7.25% from July 16, 2012 to January 15, 2013, and currently bear interest at a fixed rate of 7.25%. Interest on the 2013
Notes is payable semi-annually on January 15 and July 15 of each year, beginning January 15, 2009. Net proceeds from the sale
of the 2013 Notes were $496 million, after an initial issuance discount of $1 million and other transaction costs.
Table of Contents