Best Buy 2013 Annual Report Download - page 62
Download and view the complete annual report
Please find page 62 of the 2013 Best Buy annual report below. You can navigate through the pages in the report by either clicking on the pages listed below, or by using the keyword search tool below to find specific information within the annual report.-
 1
1 -
2
-
3
-
4
-
5
-
6
-
7
-
8
-
9
-
10
-
11
-
12
-
13
-
14
-
15
-
16
-
17
-
18
-
19
-
20
-
21
-
22
-
23
-
24
-
25
-
26
-
27
-
28
-
29
-
30
-
31
-
32
-
33
-
34
-
35
-
36
-
37
-
38
-
39
-
40
-
41
-
42
-
43
-
44
-
45
-
46
-
47
-
48
-
49
-
50
-
51
-
 52
52 -
 53
53 -
 54
54 -
 55
55 -
 56
56 -
 57
57 -
 58
58 -
 59
59 -
 60
60 -
 61
61 -
 62
62 -
 63
63 -
 64
64 -
 65
65 -
 66
66 -
 67
67 -
 68
68 -
 69
69 -
 70
70 -
 71
71 -
 72
72 -
73
-
74
-
75
-
76
-
77
-
78
-
79
-
80
-
81
-
82
-
83
-
84
-
85
-
86
-
87
-
88
-
89
-
90
-
91
-
92
-
93
-
94
-
95
-
96
-
97
-
98
-
99
-
100
-
101
-
102
-
103
-
104
-
105
-
106
-
107
-
108
-
109
-
110
-
111
-
112
-
113
-
114
-
115
-
116
 |
 |

62
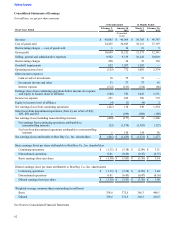
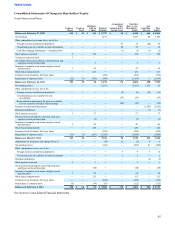
Consolidated Statements of Earnings
$ in millions, except per share amounts
11 Months Ended 12 Months Ended
Fiscal Years Ended February 2,
2013 January 28,
2012 March 3,
2012 February 26,
2011
(Unaudited
recast)
Revenue $ 45,085 $ 46,064 $ 50,705 $ 49,747
Cost of goods sold 34,435 34,693 38,113 37,197
Restructuring charges — cost of goods sold 1 19 19 9
Gross profit 10,649 11,352 12,573 12,541
Selling, general and administrative expenses 9,502 9,339 10,242 10,029
Restructuring charges 450 34 39 138
Goodwill impairments 822 1,207 1,207 —
Operating income (loss) (125) 772 1,085 2,374
Other income (expense)
Gain on sale of investments 18 55 55 —
Investment income and other 33 37 37 43
Interest expense (112)(121)(134)(86)
Earnings (loss) from continuing operations before income tax expense
and equity in income (loss) of affiliates (186) 743 1,043 2,331
Income tax expense 231 622 709 779
Equity in income (loss) of affiliates (4)(3)(4) 2
Net earnings (loss) from continuing operations (421) 118 330 1,554
Gain (loss) from discontinued operations (Note 4), net of tax of $(2),
$83, $89 and $65 1 (295)(308)(188)
Net earnings (loss) including noncontrolling interests (420)(177) 22 1,366
Net earnings from continuing operations attributable to
noncontrolling interests (22)(1,378)(1,387)(127)
Net loss from discontinued operations attributable to noncontrolling
interests 1 130 134 38
Net earnings (loss) attributable to Best Buy Co., Inc. shareholders $ (441) $ (1,425) $ (1,231) $ 1,277
Basic earnings (loss) per share attributable to Best Buy Co., Inc. shareholders
Continuing operations $ (1.31) $ (3.38) $ (2.89) $ 3.51
Discontinued operations 0.01 (0.45)(0.47)(0.37)
Basic earnings (loss) per share $ (1.30) $ (3.83) $ (3.36) $ 3.14
Diluted earnings (loss) per share attributable to Best Buy Co., Inc. shareholders
Continuing operations $ (1.31) $ (3.38) $ (2.89) $ 3.44
Discontinued operations 0.01 (0.45)(0.47)(0.36)
Diluted earnings (loss) per share $ (1.30) $ (3.83) $ (3.36) $ 3.08
Weighted-average common shares outstanding (in millions)
Basic 338.6 372.5 366.3 406.1
Diluted 338.6 372.5 366.3 416.5
See Notes to Consolidated Financial Statements.
Table of Contents