Best Buy 2013 Annual Report Download - page 42
Download and view the complete annual report
Please find page 42 of the 2013 Best Buy annual report below. You can navigate through the pages in the report by either clicking on the pages listed below, or by using the keyword search tool below to find specific information within the annual report.-
 1
1 -
2
-
3
-
4
-
5
-
6
-
7
-
8
-
9
-
10
-
11
-
12
-
13
-
14
-
15
-
16
-
17
-
18
-
19
-
20
-
21
-
22
-
23
-
24
-
25
-
26
-
27
-
28
-
29
-
30
-
31
-
 32
32 -
 33
33 -
 34
34 -
 35
35 -
 36
36 -
 37
37 -
 38
38 -
 39
39 -
 40
40 -
 41
41 -
 42
42 -
 43
43 -
 44
44 -
 45
45 -
 46
46 -
 47
47 -
 48
48 -
 49
49 -
 50
50 -
 51
51 -
 52
52 -
53
-
54
-
55
-
56
-
57
-
58
-
59
-
60
-
61
-
62
-
63
-
64
-
65
-
66
-
67
-
68
-
69
-
70
-
71
-
72
-
73
-
74
-
75
-
76
-
77
-
78
-
79
-
80
-
81
-
82
-
83
-
84
-
85
-
86
-
87
-
88
-
89
-
90
-
91
-
92
-
93
-
94
-
95
-
96
-
97
-
98
-
99
-
100
-
101
-
102
-
103
-
104
-
105
-
106
-
107
-
108
-
109
-
110
-
111
-
112
-
113
-
114
-
115
-
116
 |
 |

42
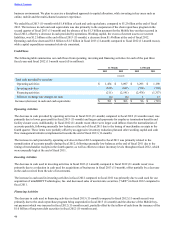
The International segment's increased operating loss in fiscal 2013 (11-month) was primarily due to the decrease in revenue,
combined with the decline in the gross profit rate, the elimination of the Best Buy Mobile profit share-based management fee
and the increase in restructuring charges. These factors were partially offset by a decrease in goodwill impairment.
Fiscal 2012 Results Compared With Fiscal 2011
For purposes of this section, fiscal 2012 represents the 12 months ended March 3, 2012 and fiscal 2011 represents the 12
months ended February 26, 2011.
During fiscal 2012, we significantly restructured our International segment. We completed the exit of our large-format Best
Buy branded stores in China and Turkey, which we had announced in the fourth quarter of fiscal 2011, and re-focused our Best
Buy Europe strategy by closing our large-format Best Buy branded stores in the U.K. to focus on our small-format stores. We
also completed the Mobile buy-out in fiscal 2012, which will allow us to fully benefit from growing connections opportunities
in the U.S. and Canada. In fiscal 2013, we plan to focus internationally on our existing markets of Canada, China and Mexico,
as well as small-format stores in Europe. Notable store opening plans in fiscal 2013 include approximately 50 new Five Star
stores in the growing market in China.
The International segment comparable store sales decline in fiscal 2012 was led primarily by declines in mobile phones as a
result of market pressure in Europe and continued market softness in gaming in Canada. However, we experienced some
positive results, including comparable store sales gains in tablets throughout the segment, as well as gains in mobile phones in
Canada and our Five Star operations. In addition, Five Star appliance sales benefited from continued government stimulus
programs, which effectively ended in December 2011. While we believe the stimulus programs were a significant driver of
appliance sales, it is not possible to quantify the impact that the expiration of the programs may have on our future results. Our
operating loss was driven primarily by a goodwill impairment charge within our Best Buy Europe reporting unit triggered by
the Mobile buy-out in the fourth quarter, which more than offset the margin improvements, particularly within key product
categories in Canada, and the decrease in restructuring charges in fiscal 2012 compared to fiscal 2011.
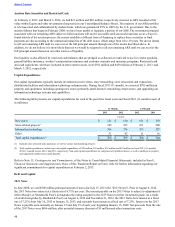
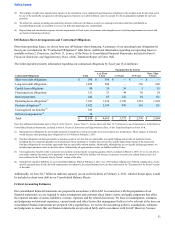
The components of the International segment's 3.3% revenue increase in fiscal 2012 were as follows:
Impact of foreign currency exchange rate fluctuations 3.6 %
Net new stores 2.6 %
Extra week of revenue(1) 0.6 %
Comparable store sales impact (1.8)%
Non-comparable sales channels(2) (1.7)%
Total revenue increase 3.3 %
(1) Reflects the incremental revenue associated with stores in Canada in fiscal 2012, which had 53 weeks of activity, compared to 52 weeks in fiscal 2011.
(2) Non-comparable sales channels primarily reflects the impact from revenue we earn from sales of merchandise to wholesalers and dealers as well as other
non-comparable sales not included within our comparable store sales calculation.
The net addition of 49 large-format stores throughout the International segment during the past 12 months (Five Star, Best Buy
Canada, Future Shop and Best Buy Mexico) contributed the majority of the change in revenue associated with net new stores.
The net addition of 56 small-format stores, including 20 new small-format Best Buy Mobile stand-alone stores in Canada and
36 net new small-format stores in Europe had a significantly smaller impact on the overall revenue change given their smaller
square footage compared to our large-format stores.
Table of Contents