Best Buy 2013 Annual Report Download - page 40
Download and view the complete annual report
Please find page 40 of the 2013 Best Buy annual report below. You can navigate through the pages in the report by either clicking on the pages listed below, or by using the keyword search tool below to find specific information within the annual report.-
 1
1 -
2
-
3
-
4
-
5
-
6
-
7
-
8
-
9
-
10
-
11
-
12
-
13
-
14
-
15
-
16
-
17
-
18
-
19
-
20
-
21
-
22
-
23
-
24
-
25
-
26
-
27
-
28
-
29
-
 30
30 -
 31
31 -
 32
32 -
 33
33 -
 34
34 -
 35
35 -
 36
36 -
 37
37 -
 38
38 -
 39
39 -
 40
40 -
 41
41 -
 42
42 -
 43
43 -
 44
44 -
 45
45 -
 46
46 -
 47
47 -
 48
48 -
 49
49 -
 50
50 -
51
-
52
-
53
-
54
-
55
-
56
-
57
-
58
-
59
-
60
-
61
-
62
-
63
-
64
-
65
-
66
-
67
-
68
-
69
-
70
-
71
-
72
-
73
-
74
-
75
-
76
-
77
-
78
-
79
-
80
-
81
-
82
-
83
-
84
-
85
-
86
-
87
-
88
-
89
-
90
-
91
-
92
-
93
-
94
-
95
-
96
-
97
-
98
-
99
-
100
-
101
-
102
-
103
-
104
-
105
-
106
-
107
-
108
-
109
-
110
-
111
-
112
-
113
-
114
-
115
-
116
 |
 |

40
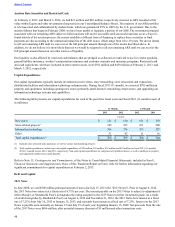
The following table reconciles our International segment stores open at the end of each of the last three fiscal years:
Fiscal 2011 Fiscal 2012 Fiscal 2013 (11-Month)(1)
Total Stores
at End of
Fiscal Year Stores
Opened Stores
Closed
Total Stores
at End of
Fiscal Year Stores
Opened Stores
Closed
Total Stores
at End of
Fiscal Year
Best Buy Europe(2) 2,357 145 (109) 2,393 122 (126) 2,389
Canada
Future Shop 146 5 (2) 149 — (9) 140
Best Buy 71 6 — 77 2 (7) 72
Best Buy Mobile stand-alone 10 20 — 30 19 — 49
China
Five Star 166 41 (3) 204 12 (5) 211
Mexico
Best Buy 6 2 — 8 6 — 14
Express — — — — 1 — 1
Total International segment stores 2,756 219 (114) 2,861 162 (147) 2,876
(1) Fiscal 2013 includes store opening and closing activity for the month of January for Best Buy Europe, China and Mexico.
(2) Represents small-format The Carphone Warehouse and The Phone House stores.
Fiscal 2013 (11-month) Results Compared With Fiscal 2012 (11-month recast)
For purposes of this section, fiscal 2013 (11-month) represents the 11-month transition period ended February 2, 2013 and
fiscal 2012 (11-month recast) represents the comparable 11-month period ended January 28, 2012.
We experienced differing comparable store sales in the various geographies in our International segment. In Europe, we
experienced a comparable store sales gain due to effective promotions and an increase in sales of higher-priced mobile phone
handsets. In Canada, comparable store sales declines were the result of overall industry softness leading to declines in
televisions, computers and gaming, which were partially offset by increased sales of mobile phones and tablets. In China,
increased competition from online competitors pressured prices across most product categories, while the end of certain
government stimulus programs in December 2011 continued to have a negative impact on appliances. The combination of
lower sales in Canada and China, as well as a decrease in the gross profit rate in Europe due to an increased mix of wholesale
sales, an unfavorable product mix and greater promotional activity, resulted in lower gross profit and operating income in our
International segment.
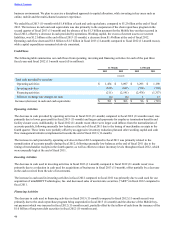
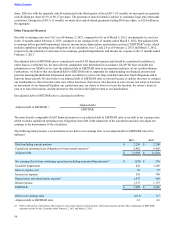
The components of the International segment's 1.8% revenue decrease in fiscal 2013 (11-month) were as follows:
Comparable store sales impact (6.0)%
Net store changes 1.7 %
Non-comparable store sales channels(1) 1.5 %
Impact of foreign currency exchange rate fluctuations 1.0 %
Total revenue decrease (1.8)%
(1) Non-comparable store sales channels primarily reflects the impact from revenue we earn from sales of merchandise to wholesalers and dealers, as well as
other non-comparable sales not included within our comparable store sales calculation.
The addition of 20 large-format stores throughout the International segment during the past 11 months (Five Star, Best Buy
Mexico and Best Buy Canada) contributed to the majority of the change in revenue associated with net new stores. The impact
of the closure of 21 large-format stores in the International segment (Future Shop, Best Buy Canada and Five Star) had minimal
impact on revenue, as the majority of the closures occurred late in the fourth quarter. The net addition of 16 small-format stores,
including 19 new small-format Best Buy Mobile stand-alone stores in Canada, had a significantly smaller impact on the overall
revenue change given their smaller square footage compared to our large-format stores.
Table of Contents