Best Buy 2013 Annual Report Download - page 43
Download and view the complete annual report
Please find page 43 of the 2013 Best Buy annual report below. You can navigate through the pages in the report by either clicking on the pages listed below, or by using the keyword search tool below to find specific information within the annual report.-
 1
1 -
2
-
3
-
4
-
5
-
6
-
7
-
8
-
9
-
10
-
11
-
12
-
13
-
14
-
15
-
16
-
17
-
18
-
19
-
20
-
21
-
22
-
23
-
24
-
25
-
26
-
27
-
28
-
29
-
30
-
31
-
32
-
 33
33 -
 34
34 -
 35
35 -
 36
36 -
 37
37 -
 38
38 -
 39
39 -
 40
40 -
 41
41 -
 42
42 -
 43
43 -
 44
44 -
 45
45 -
 46
46 -
 47
47 -
 48
48 -
 49
49 -
 50
50 -
 51
51 -
 52
52 -
 53
53 -
54
-
55
-
56
-
57
-
58
-
59
-
60
-
61
-
62
-
63
-
64
-
65
-
66
-
67
-
68
-
69
-
70
-
71
-
72
-
73
-
74
-
75
-
76
-
77
-
78
-
79
-
80
-
81
-
82
-
83
-
84
-
85
-
86
-
87
-
88
-
89
-
90
-
91
-
92
-
93
-
94
-
95
-
96
-
97
-
98
-
99
-
100
-
101
-
102
-
103
-
104
-
105
-
106
-
107
-
108
-
109
-
110
-
111
-
112
-
113
-
114
-
115
-
116
 |
 |

43
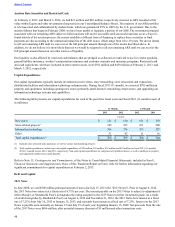
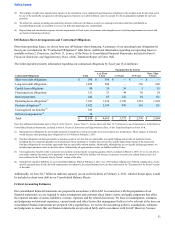
The following table presents the International segment's revenue mix percentages and comparable store sales percentage
changes by revenue category in fiscal 2012 and 2011:
Revenue Mix Summary Comparable Store Sales Summary
12 Months Ended 12 Months Ended
March 3, 2012 February 26, 2011 March 3, 2012 February 26, 2011
Consumer Electronics 20% 20% (6.9)% (2.8)%
Computing and Mobile Phones 56% 55% — % 4.9 %
Entertainment 5% 6% (13.3)% (12.4)%
Appliances 10% 9% 4.5 % 15.8 %
Services 9% 10% (1.3)% (1.6)%
Other <1% <1% n/a n/a
Total 100% 100% (2.1)% 2.3 %
The following is a description of the notable comparable store sales changes in our International segment by revenue category:
• Consumer Electronics: The 6.9% comparable store sales decline was driven primarily by decreases in the sales of
digital imaging products and televisions as a result of similar factors to those experienced within our Domestic
segment.
• Computing and Mobile Phones: The flat comparable store sales resulted from decreased mobile phone sales in our
small-format stores in Europe, as well as declines in the sales of desktops and monitors, as consumer preference
continued to shift toward mobile computing devices. These declines were fully offset by increased sales of mobile
computing devices due to strong tablet sales and increased sales of mobile phones throughout the remainder of the
stores in our International segment.
• Entertainment: The 13.3% comparable store sales decline resulted primarily from decreases in the sales of gaming in
Canada due to overall market softness, similar to trends seen in our Domestic segment.
• Appliances: The 4.5% comparable store sales gain was primarily due to an increase in the sales of appliances in our
Five Star operations, as consumers continued to take advantage of government stimulus programs before they
effectively ended in December 2011. Broadly, the stimulus programs provided customers a subsidy or discount when
purchasing a new energy-efficient appliance and trading in their old appliance.
• Services: The 1.3% comparable store sales decline was due to a decrease in the sales of extended warranties and
repair services, partially offset by an increase in the customer base in our mobile virtual network operator and fixed
line services in Europe.
Our International segment experienced gross profit growth in fiscal 2012 of $160 million, or 5.0%. The increase in gross profit
was primarily due to the favorable impact of foreign currency exchange rate fluctuations and increased gross profit from our
stores in Canada and our Five Star operations, partially offset by a gross profit decline in our small-format stores in Europe.
The 0.4% of revenue increase in the gross profit rate reflected the following factors:
• improved margin rates in Canada, especially in televisions and notebook computers; and
• an improved margin rate in Five Star as a result of improved cost programs with vendors;
• partially offset by higher sales in our Five Star business, which has a relatively lower gross profit rate; and
• a rate decrease in our small-format stores in Europe due to market pressures.
Our International segment's SG&A increased $135 million, or 4.8%, in fiscal 2012, driven primarily by the impact of foreign
currency exchange rate fluctuations. Excluding the impact of foreign currency exchange rate fluctuations, our International
segment's SG&A increased $41 million. The increase in SG&A spending and the 0.3% of revenue increase in the SG&A rate
were both driven by a decrease in the Best Buy Mobile profit share-based management fee and other costs as a result of the
strategic changes made at Best Buy Europe, and increased advertising costs and the deleveraging impact of negative
comparable store sales in Canada. These increases were partially offset by lower overall spending in our small-format stores in
Europe and a decrease in support costs for our International segment due to previous restructuring activities. For further
information on the strategic changes at Best Buy Europe, see Additional Consolidated Results, below.
Our International segment recorded $15 million and $107 million of restructuring charges in fiscal 2012 and 2011, respectively.
The restructuring charges consisted of property and equipment impairments related to information technology ("IT") assets as a
Table of Contents