Best Buy 2013 Annual Report Download - page 65
Download and view the complete annual report
Please find page 65 of the 2013 Best Buy annual report below. You can navigate through the pages in the report by either clicking on the pages listed below, or by using the keyword search tool below to find specific information within the annual report.-
 1
1 -
2
-
3
-
4
-
5
-
6
-
7
-
8
-
9
-
10
-
11
-
12
-
13
-
14
-
15
-
16
-
17
-
18
-
19
-
20
-
21
-
22
-
23
-
24
-
25
-
26
-
27
-
28
-
29
-
30
-
31
-
32
-
33
-
34
-
35
-
36
-
37
-
38
-
39
-
40
-
41
-
42
-
43
-
44
-
45
-
46
-
47
-
48
-
49
-
50
-
51
-
52
-
53
-
54
-
 55
55 -
 56
56 -
 57
57 -
 58
58 -
 59
59 -
 60
60 -
 61
61 -
 62
62 -
 63
63 -
 64
64 -
 65
65 -
 66
66 -
 67
67 -
 68
68 -
 69
69 -
 70
70 -
 71
71 -
 72
72 -
 73
73 -
 74
74 -
 75
75 -
76
-
77
-
78
-
79
-
80
-
81
-
82
-
83
-
84
-
85
-
86
-
87
-
88
-
89
-
90
-
91
-
92
-
93
-
94
-
95
-
96
-
97
-
98
-
99
-
100
-
101
-
102
-
103
-
104
-
105
-
106
-
107
-
108
-
109
-
110
-
111
-
112
-
113
-
114
-
115
-
116
 |
 |

65
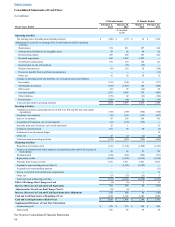
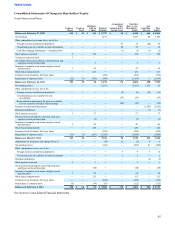
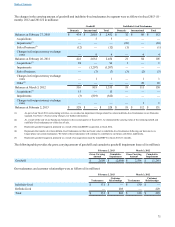
Consolidated Statements of Changes in Shareholders' Equity
$ and shares in millions
Common
Shares Common
Stock
Additional
Paid-In
Capital Retained
Earnings
Accumulated
Other
Comprehensive
Income (Loss)
Total Best
Buy Co., Inc.
Shareholders'
Equity
Non
controlling
Interests Total
Equity
Balances at February 27, 2010 419 $ 42 $ 441 $ 5,797 $ 40 $ 6,320 $ 644 $ 6,964
Net earnings — — — 1,277 — 1,277 89 1,366
Other comprehensive income (loss), net of tax:
Foreign currency translation adjustments — — — — 76 76 (42) 34
Unrealized gains on available-for-sale investments — — — — 58 58 — 58
Cash flow hedging instruments — unrealized loss — — — — (1) (1) (1) (2)
Stock options exercised 4 — 134 — — 134 — 134
Vesting of restricted stock 1 — — — — — — —
Tax benefits from stock options, restricted stock and
employee stock purchase plan — — 3 — — 3 — 3
Issuance of common stock under employee stock
purchase plan 1 — 45 — — 45 — 45
Stock-based compensation — — 121 — — 121 — 121
Common stock dividends, $0.58 per share — — — (238) — (238) — (238)
Repurchase of common stock (32) (3) (726) (464) — (1,193) — (1,193)
Balances at February 26, 2011 393 39 18 6,372 173 6,602 690 7,292
Net earnings (loss) — — — (1,231) — (1,231) 1,253 22
Other comprehensive loss, net of tax:
Foreign currency translation adjustments — — — — (9) (9) (12) (21)
Unrealized losses on available-for-sale
investments — — — — (26) (26) — (26)
Reclassification adjustment for gain on available-
for-sale securities included in net earnings — — — — (48) (48) — (48)
Payment to noncontrolling interest — — — — — — (1,303) (1,303)
Dividend distribution — — — — — — (7) (7)
Stock options exercised 1 — 27 — — 27 — 27
Tax loss from stock options, restricted stock and
employee stock purchase plan — — (2) — — (2) — (2)
Issuance of common stock under employee stock
purchase plan 2 — 40 — — 40 — 40
Stock-based compensation — — 120 — — 120 — 120
Common stock dividends, $0.62 per share — — — (228) — (228) — (228)
Repurchase of common stock (55) (5) (203) (1,292) — (1,500) — (1,500)
Balances at March 3, 2012 341 34 — 3,621 90 3,745 621 4,366
Adjustment for fiscal year-end change (Note 2) — — — (14) 11 (3) 9 6
Net earnings (loss) — — — (441) — (441) 21 (420)
Other comprehensive loss, net of tax:
Foreign currency translation adjustments — — — — 9 9 6 15
Unrealized gains on available-for-sale investments — — — — 2 2 — 2
Dividend distribution — — — — — — (3) (3)
Stock options exercised 2 — 1 — — 1 — 1
Tax loss from stock options, restricted stock and
employee stock purchase plan — — (44) — — (44) — (44)
Issuance of common stock under employee stock
purchase plan 1 — 24 — — 24 — 24
Stock-based compensation — — 112 — — 112 — 112
Common stock dividends, $0.66 per share — — — (222) — (222) — (222)
Repurchase of common stock (6) — (39) (83) — (122) — (122)
Balances at February 2, 2013 338 $ 34 $ 54 $ 2,861 $ 112 $ 3,061 $ 654 $ 3,715
See Notes to Consolidated Financial Statements.
Table of Contents