Best Buy 2013 Annual Report Download - page 107
Download and view the complete annual report
Please find page 107 of the 2013 Best Buy annual report below. You can navigate through the pages in the report by either clicking on the pages listed below, or by using the keyword search tool below to find specific information within the annual report.-
 1
1 -
2
-
3
-
4
-
5
-
6
-
7
-
8
-
9
-
10
-
11
-
12
-
13
-
14
-
15
-
16
-
17
-
18
-
19
-
20
-
21
-
22
-
23
-
24
-
25
-
26
-
27
-
28
-
29
-
30
-
31
-
32
-
33
-
34
-
35
-
36
-
37
-
38
-
39
-
40
-
41
-
42
-
43
-
44
-
45
-
46
-
47
-
48
-
49
-
50
-
51
-
52
-
53
-
54
-
55
-
56
-
57
-
58
-
59
-
60
-
61
-
62
-
63
-
64
-
65
-
66
-
67
-
68
-
69
-
70
-
71
-
72
-
73
-
74
-
75
-
76
-
77
-
78
-
79
-
80
-
81
-
82
-
83
-
84
-
85
-
86
-
87
-
88
-
89
-
90
-
91
-
92
-
93
-
94
-
95
-
96
-
 97
97 -
 98
98 -
 99
99 -
 100
100 -
 101
101 -
 102
102 -
 103
103 -
 104
104 -
 105
105 -
 106
106 -
 107
107 -
 108
108 -
 109
109 -
 110
110 -
 111
111 -
 112
112 -
 113
113 -
 114
114 -
 115
115 -
 116
116
 |
 |

107
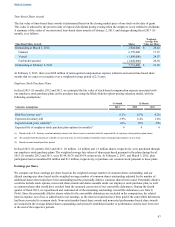
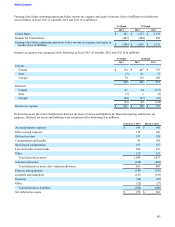
17. Supplementary Financial Information (Unaudited)
The following tables show selected operating results for each 3-month quarter and full year of fiscal 2013 (11-month) and 2012
(unaudited) ($ in millions):
Quarter 11-Month
1st 2nd 3rd 4th 2013(1)
Revenue $ 11,610 $ 10,547 $ 10,753 $ 16,711 $ 45,085
Comparable store sales % change(2) (5.3)% (3.2)% (4.3)% (0.8)% (2.9)%
Gross profit $ 2,907 $ 2,564 $ 2,586 $ 3,781 $ 10,649
Operating income (loss)(3) 262 33 12 (145) (125)
Net earnings (loss) from continuing operations 161 (7) (5) (377) (421)
Gain (loss) from discontinued operations, net of tax (9) — 6 (2) 1
Net earnings (loss) including noncontrolling
interests 152 (7) 1 (379) (420)
Net earnings (loss) attributable to Best Buy Co.,
Inc. shareholders $ 158 $ 12 $ (10) $ (409) $ (441)
Diluted earnings (loss) per share(4)
Continuing operations $ 0.47 $ 0.04 $ (0.04) $ (1.21) $ (1.31)
Discontinued operations (0.01) — 0.01 — 0.01
Diluted earnings (loss) per share $ 0.46 $ 0.04 $ (0.03) $ (1.21) $ (1.30)
Quarter 12-Month
1st 2nd 3rd 4th 2012
Revenue $ 10,812 $ 11,259 $ 12,004 $ 16,630 $ 50,705
Comparable store sales % change(2) (1.8)% (2.9)% 0.3% (2.4)% (1.7)%
Gross profit $ 2,746 $ 2,848 $ 2,922 $ 4,057 $ 12,573
Operating income(5) 330 335 351 69 1,085
Net earnings (loss) from continuing operations 199 197 258 (324) 330
Loss from discontinued operations, net of tax (36) (37) (127) (108) (308)
Net earnings (loss) including noncontrolling
interests 163 160 131 (432) 22
Net earnings (loss) attributable to Best Buy Co.,
Inc. shareholders(6) $ 136 $ 177 $ 154 $ (1,698) $ (1,231)
Diluted earnings (loss) per share(4)
Continuing operations $ 0.41 $ 0.52 $ 0.62 $ (4.73) $ (2.89)
Discontinued operations (0.06) (0.05) (0.20) (0.16) (0.47)
Diluted earnings (loss) per share $ 0.35 $ 0.47 $ 0.42 $ (4.89) $ (3.36)
Note: Certain fiscal year totals may not add due to rounding.
(1) On November 2, 2011, our Board of Directors approved a change to our fiscal year-end from the Saturday nearest the end of February to the Saturday
nearest the end of January. In the first quarter of fiscal 2013 (11-month), we began reporting our quarterly results on the basis of our new fiscal year-end.
As such, the results for the month of February 2012, which are included in the audited results for fiscal 2012, were also included in the reported first
quarter of fiscal 2013 (11-month). However, the results for the month of February 2012 are not included in the results for the full year of fiscal 2013 (11-
month). Thus, the four quarters of fiscal year 2013 (11-month) are not additive.
(2) Comprised of revenue from stores operating for at least 14 full months as well as revenue related to call centers, websites and our other comparable sales
channels. Revenue we earn from sales of merchandise to wholesalers or dealers is not included within our comparable store sales calculation. Relocated,
remodeled and expanded stores are excluded from our comparable store sales calculation until at least 14 full months after reopening. Acquired stores are
included in our comparable store sales calculation beginning with the first full quarter following the first anniversary of the date of the acquisition. The
portion of our calculation of the comparable store sales percentage change attributable to our International segment excludes the effect of fluctuations in
foreign currency exchange rates. The method of calculating comparable store sales varies across the retail industry. As a result, our method of calculating
comparable store sales may not be the same as other retailers' methods. The calculation of comparable store sales excludes the impact of the extra week of
revenue in the fourth quarter of fiscal 2012, as well as revenue from discontinued operations for all periods presented.
Table of Contents