Best Buy 2013 Annual Report Download - page 81
Download and view the complete annual report
Please find page 81 of the 2013 Best Buy annual report below. You can navigate through the pages in the report by either clicking on the pages listed below, or by using the keyword search tool below to find specific information within the annual report.-
 1
1 -
2
-
3
-
4
-
5
-
6
-
7
-
8
-
9
-
10
-
11
-
12
-
13
-
14
-
15
-
16
-
17
-
18
-
19
-
20
-
21
-
22
-
23
-
24
-
25
-
26
-
27
-
28
-
29
-
30
-
31
-
32
-
33
-
34
-
35
-
36
-
37
-
38
-
39
-
40
-
41
-
42
-
43
-
44
-
45
-
46
-
47
-
48
-
49
-
50
-
51
-
52
-
53
-
54
-
55
-
56
-
57
-
58
-
59
-
60
-
61
-
62
-
63
-
64
-
65
-
66
-
67
-
68
-
69
-
70
-
 71
71 -
 72
72 -
 73
73 -
 74
74 -
 75
75 -
 76
76 -
 77
77 -
 78
78 -
 79
79 -
 80
80 -
 81
81 -
 82
82 -
 83
83 -
 84
84 -
 85
85 -
 86
86 -
 87
87 -
 88
88 -
 89
89 -
 90
90 -
 91
91 -
92
-
93
-
94
-
95
-
96
-
97
-
98
-
99
-
100
-
101
-
102
-
103
-
104
-
105
-
106
-
107
-
108
-
109
-
110
-
111
-
112
-
113
-
114
-
115
-
116
 |
 |

81
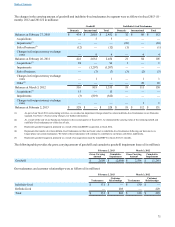
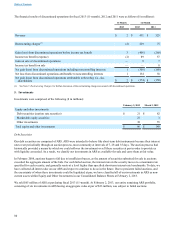
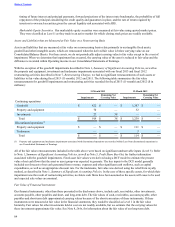
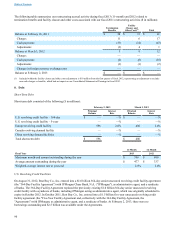
Our ARS portfolio consisted of the following, at fair value ($ in millions):
Description Nature of collateral or guarantee February 2, 2013 March 3, 2012
Student loan bonds Student loans guaranteed 95% to 100% by
the U.S. government $ 19 $ 80
Municipal revenue bonds 100% insured by AAA/Aaa-rated bond
insurers at February 2, 2013 2 2
Total fair value plus accrued interest(1) $ 21 $ 82
(1) The par value and weighted-average interest rates (taxable equivalent) of our ARS were $23 million and $88 million and 0.4% and 0.5%, respectively, at
February 2, 2013, and March 3, 2012, respectively.
At February 2, 2013, our ARS portfolio was 35% AAA/Aaa-rated, 20% AA/Aa-rated and 45% A/A-rated.
The investment principal associated with failed auctions will not be accessible until successful auctions occur, a buyer is found
outside of the auction process, the issuers establish a different form of financing to replace these securities, or final payments
are due according to the contractual maturities of the debt issuances, which range from 10 to 29 years. We do not intend to sell
our remaining ARS until we can recover the full principal amount through one of the means described above. In addition, we
do not believe it is more likely than not that we would be required to sell our remaining ARS until we can recover the full
principal amount based on our other sources of liquidity.
We evaluated our entire ARS portfolio of $23 million (par value) for impairment at February 2, 2013, based primarily on the
methodology described in Note 6, Fair Value Measurements. As a result of this review, we determined that the fair value of our
ARS portfolio at February 2, 2013, was $21 million. Accordingly, a $2 million pre-tax unrealized loss is recognized in
accumulated other comprehensive income. This unrealized loss reflects a temporary impairment on all of our investments in
ARS. The estimated fair value of our ARS portfolio could change significantly based on future market conditions. We will
continue to assess the fair value of our ARS portfolio for substantive changes in relevant market conditions, changes in our
financial condition or other changes that may alter our estimates described above.
We may be required to record an additional unrealized holding loss or an impairment charge to earnings if we determine that
our ARS portfolio has incurred a further decline in fair value that is temporary or other-than-temporary, respectively. Factors
that we consider when assessing our ARS portfolio for other-than-temporary impairment include the duration and severity of
the impairment, the reason for the decline in value, the potential recovery period, the nature of the collateral or guarantees in
place and our intent and ability to hold an investment.
We had $1 million and $3 million unrealized loss, net of tax, recorded in accumulated other comprehensive income at
February 2, 2013, and March 3, 2012, respectively, related to our investments in debt securities.
Marketable Equity Securities
We invest in marketable equity securities and classify them as available-for-sale. Investments in marketable equity securities
are classified as non-current assets within Equity and Other Investments in our Consolidated Balance Sheets, and are reported
at fair value based on quoted market prices. Our investments in marketable equity securities were $27 million and $3 million at
February 2, 2013, and March 3, 2012, respectively.
We review all investments for other-than-temporary impairment at least quarterly or as indicators of impairment exist.
Indicators of impairment include the duration and severity of the decline in fair value as well as the intent and ability to hold
the investment to allow for a recovery in the market value of the investment. In addition, we consider qualitative factors that
include, but are not limited to: (i) the financial condition and business plans of the investee including its future earnings
potential, (ii) the investee’s credit rating, and (iii) the current and expected market and industry conditions in which the investee
operates. If a decline in the fair value of an investment is deemed by management to be other-than-temporary, the cost basis of
the investment is written down to fair value, and the amount of the write-down is included in net earnings.
All unrealized holding gains or losses related to our investments in marketable equity securities are reflected net of tax in
accumulated other comprehensive income in shareholders' equity. Net unrealized gain, net of tax, included in accumulated
other comprehensive income was $3 million and $0 million at February 2, 2013, and March 3, 2012, respectively.
Table of Contents