Charter 2009 Annual Report Download - page 24
Download and view the complete annual report
Please find page 24 of the 2009 Charter annual report below. You can navigate through the pages in the report by either clicking on the pages listed below, or by using the keyword search tool below to find specific information within the annual report.-
 1
1 -
2
-
3
-
4
-
5
-
6
-
7
-
8
-
9
-
10
-
11
-
12
-
13
-
 14
14 -
 15
15 -
 16
16 -
 17
17 -
 18
18 -
 19
19 -
 20
20 -
 21
21 -
 22
22 -
 23
23 -
 24
24 -
 25
25 -
 26
26 -
 27
27 -
 28
28 -
 29
29 -
 30
30 -
 31
31 -
 32
32 -
 33
33 -
 34
34 -
35
-
36
-
37
-
38
-
39
-
40
-
41
-
42
-
43
-
44
-
45
-
46
-
47
-
48
-
49
-
50
-
51
-
52
-
53
-
54
-
55
-
56
-
57
-
58
-
59
-
60
-
61
-
62
-
63
-
64
-
65
-
66
-
67
-
68
-
69
-
70
-
71
-
72
-
73
-
74
-
75
-
76
-
77
-
78
-
79
-
80
-
81
-
82
-
83
-
84
-
85
-
86
-
87
-
88
-
89
-
90
 |
 |
21
speed Internet, OnDemand, DVR, high definition television, and telephone. We expect to continue to grow
revenues in this manner and in addition, we expect to increase revenues by expanding the sales of our services to our
commercial customers. However, we do not expect that we will be able to grow revenues at recent historical rates.
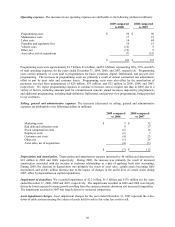
Our expenses primarily consist of operating costs, selling, general and administrative expenses, depreciation and
amortization expense, impairment of franchise intangibles and interest expense. Operating costs primarily include
programming costs, the cost of our workforce, cable service related expenses, advertising sales costs and franchise
fees. Selling, general and administrative expenses primarily include salaries and benefits, rent expense, billing
costs, call center costs, internal network costs, bad debt expense, and property taxes. We control our costs of
operations by maintaining strict controls on expenditures. More specifically, we are focused on managing our cost
structure by improving workforce productivity, and leveraging our scale, and increasing the effectiveness of our
purchasing activities.
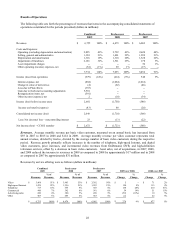
For the years ended December 31, 2009, 2008 and 2007, adjusted earnings (loss) before interest expense, income
taxes, depreciation and amortization (“Adjusted EBITDA”) was $2.5 billion, $2.3 billion and $2.1 billion,
respectively. See “—Use of Adjusted EBITDA” for further information on Adjusted EBITDA. The increase in
Adjusted EBITDA is principally due to increased sales of our bundled services and improved cost efficiencies. For
the years ended December 31, 2009 and 2008, our loss from operations was $979 million and $614 million,
respectively. The increase in the loss from operations for the year ended December 31, 2009 as compared to the
year ended December 31, 2008 is a result of the increase in the impairment of franchises from $1.5 billion in 2008 to
$2.2 billion in 2009 offset by increases in Adjusted EBITDA as discussed above and favorable litigation settlements
in 2009. Income from operations was $548 million for the year ended December 31, 2007 which was not as
significantly impacted by impairment of franchises.
We have a history of net losses. Our net losses were principally attributable to insufficient revenue to cover the
combination of operating expenses and interest expenses we incurred because of our debt, impairment of franchises
and depreciation expenses resulting from the capital investments we have made and continue to make in our cable
properties.
Beginning in 2004 and continuing through 2009, we sold several cable systems to divest geographically non-
strategic assets and allow for more efficient operations, while also reducing debt and increasing our liquidity. In
2007, 2008, and 2009, we closed the sale of certain cable systems representing a total of approximately 85,100,
14,100, and 13,200 video customers, respectively. As a result of these sales we have improved our geographic
footprint by reducing our number of headends, increasing the number of customers per headend, and reducing the
number of states in which the majority of our customers reside. We also made certain geographically strategic
acquisitions in 2007 and 2009, adding 25,500 and 1,900 video customers, respectively.
Critical Accounting Policies and Estimates
Certain of our accounting policies require our management to make difficult, subjective or complex judgments.
Management has discussed these policies with the Audit Committee of Charter’ s board of directors, and the Audit
Committee has reviewed the following disclosure. We consider the following policies to be the most critical in
understanding the estimates, assumptions and judgments that are involved in preparing our financial statements, and
the uncertainties that could affect our results of operations, financial condition and cash flows:
• Property, plant and equipment
• Capitalization of labor and overhead costs
• Impairment
• Valuation for fresh start accounting
• Useful lives of property, plant and equipment
• Intangible assets
• Impairment of franchises
• Valuation for fresh start accounting
• Sensitivity
• Income Taxes
• Litigation