Charter 2009 Annual Report Download - page 33
Download and view the complete annual report
Please find page 33 of the 2009 Charter annual report below. You can navigate through the pages in the report by either clicking on the pages listed below, or by using the keyword search tool below to find specific information within the annual report.-
 1
1 -
2
-
3
-
4
-
5
-
6
-
7
-
8
-
9
-
10
-
11
-
12
-
13
-
14
-
15
-
16
-
17
-
18
-
19
-
20
-
21
-
22
-
 23
23 -
 24
24 -
 25
25 -
 26
26 -
 27
27 -
 28
28 -
 29
29 -
 30
30 -
 31
31 -
 32
32 -
 33
33 -
 34
34 -
 35
35 -
 36
36 -
 37
37 -
 38
38 -
 39
39 -
 40
40 -
 41
41 -
 42
42 -
 43
43 -
44
-
45
-
46
-
47
-
48
-
49
-
50
-
51
-
52
-
53
-
54
-
55
-
56
-
57
-
58
-
59
-
60
-
61
-
62
-
63
-
64
-
65
-
66
-
67
-
68
-
69
-
70
-
71
-
72
-
73
-
74
-
75
-
76
-
77
-
78
-
79
-
80
-
81
-
82
-
83
-
84
-
85
-
86
-
87
-
88
-
89
-
90
 |
 |

30
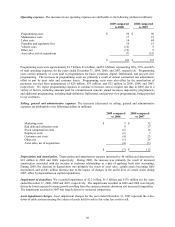
Operating expenses. The increases in our operating expenses are attributable to the following (dollars in millions):
2009 compared
to 2008
2008 compared
to 2007
Programming costs $ 96 $ 90
Maintenance costs 17 19
Labor costs 14 44
Franchise and regulatory fees 10 23
Vehicle costs (12) 9
Other, net (15) 9
Asset sales, net of acquisitions (7) (22)
$ 103 $ 172
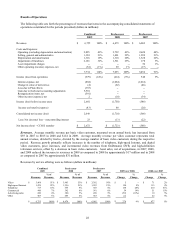
Programming costs were approximately $1.7 billion, $1.6 billion, and $1.6 billion, representing 60%, 59%, and 60%
of total operating expenses for the years ended December 31, 2009, 2008, and 2007, respectively. Programming
costs consist primarily of costs paid to programmers for basic, premium, digital, OnDemand, and pay-per-view
programming. The increases in programming costs are primarily a result of annual contractual rate adjustments,
offset in part by asset sales and customer losses. Programming costs were also offset by the amortization of
payments received from programmers of $26 million, $33 million, and $25 million in 2009, 2008, and 2007,
respectively. We expect programming expenses to continue to increase, and at a higher rate than in 2009, due to a
variety of factors, including amounts paid for retransmission consent, annual increases imposed by programmers,
and additional programming, including high-definition, OnDemand, and pay-per-view programming, being provided
to our customers.
Selling, general and administrative expenses. The increases (decreases) in selling, general and administrative
expenses are attributable to the following (dollars in millions):
2009 compared
to 2008
2008 compared
to 2007
Marketing costs $ 5 $ 32
Bad debt and collection costs 9 17
Stock compensation costs (6) 14
Employee costs (6) 7
Customer care costs (4) 23
Other, net (1) 24
Asset sales, net of acquisitions (4) (5)
$ (7) $ 112
Depreciation and amortization. Depreciation and amortization expense increased by $6 million and decreased by
$18 million in 2009 and 2008, respectively. During 2009, the increase was primarily the result of increased
amortization associated with the increase in customer relationships as a part of applying fresh start accounting.
During 2008, the decrease in depreciation was primarily the result of asset sales, certain assets becoming fully
depreciated, and an $81 million decrease due to the impact of changes in the useful lives of certain assets during
2007, offset by depreciation on capital expenditures.
Impairment of franchises. We recorded impairment of $2.2 billion, $1.5 billion and $178 million for the years
ended December 31, 2009, 2008 and 2007, respectively. The impairments recorded in 2009 and 2008 were largely
driven by lower expected revenue growth resulting from the current economic downturn and increased competition.
The impairment recorded in 2007 was largely driven by increased competition.
Asset impairment charges. Asset impairment charges for the year ended December 31, 2007 represent the write-
down of cable systems meeting the criteria of assets held for sale to fair value less costs to sell.