Charter 2009 Annual Report Download - page 68
Download and view the complete annual report
Please find page 68 of the 2009 Charter annual report below. You can navigate through the pages in the report by either clicking on the pages listed below, or by using the keyword search tool below to find specific information within the annual report.-
 1
1 -
2
-
3
-
4
-
5
-
6
-
7
-
8
-
9
-
10
-
11
-
12
-
13
-
14
-
15
-
16
-
17
-
18
-
19
-
20
-
21
-
22
-
23
-
24
-
25
-
26
-
27
-
28
-
29
-
30
-
31
-
32
-
33
-
34
-
35
-
36
-
37
-
38
-
39
-
40
-
41
-
42
-
43
-
44
-
45
-
46
-
47
-
48
-
49
-
50
-
51
-
52
-
53
-
54
-
55
-
56
-
57
-
 58
58 -
 59
59 -
 60
60 -
 61
61 -
 62
62 -
 63
63 -
 64
64 -
 65
65 -
 66
66 -
 67
67 -
 68
68 -
 69
69 -
 70
70 -
 71
71 -
 72
72 -
 73
73 -
 74
74 -
 75
75 -
 76
76 -
 77
77 -
 78
78 -
79
-
80
-
81
-
82
-
83
-
84
-
85
-
86
-
87
-
88
-
89
-
90
 |
 |

CCH II, LLC AND SUBSIDIARIES
NOTES TO CONSOLIDATED FINANCIAL STATEMENTS
DECEMBER 31, 2009, 2008, AND 2007
(dollars in millions, except where indicated)
F-20
historical operating performance adjusted for current and expected competitive and economic factors surrounding
the cable industry. The estimates and assumptions made in the Company’ s valuations are inherently subject to
significant uncertainties, many of which are beyond its control, and there is no assurance that these results can be
achieved. The primary assumptions for which there is a reasonable possibility of the occurrence of a variation that
would significantly affect the measurement value include the assumptions regarding revenue growth, programming
expense growth rates, the amount and timing of capital expenditures and the discount rate utilized. The assumptions
used are consistent with current internal forecasts, some of which differ from the assumptions used for the annual
impairment testing in December 2008 as a result of the economic and competitive environment discussed
previously. The change in assumptions reflects the lower than anticipated growth in revenues experienced during
2009 and the expected reduction of future cash flows as compared to those used in the December 2008 valuations.
Franchises, for valuation purposes, are defined as the future economic benefits of the right to solicit and service
potential customers (customer marketing rights), and the right to deploy and market new services, such as
interactivity and telephone, to potential customers (service marketing rights). Fair value is determined based on
estimated discrete discounted future cash flows using assumptions consistent with internal forecasts. The franchise
after-tax cash flow is calculated as the after-tax cash flow generated by the potential customers obtained (less the
anticipated customer churn), and the new services added to those customers in future periods. The sum of the
present value of the franchises' after-tax cash flow in years 1 through 10 and the continuing value of the after-tax
cash flow beyond year 10 yields the fair value of the franchises. Franchises increased $62 million as a result of the
application of fresh start accounting. Subsequent to finalization of the franchise impairment charge and fresh start
accounting, franchises are recorded at fair value of $5.3 billion. Franchises are expected to generate cash flows
indefinitely and as such will continue to be tested for impairment annually.
Customer relationships, for valuation purposes, represent the value of the business relationship with existing
customers (less the anticipated customer churn), and are calculated by projecting the discrete future after-tax cash
flows from these customers, including the right to deploy and market additional services to these customers. The
present value of these after-tax cash flows yields the fair value of the customer relationships. The Company
recorded $2.4 billion of customer relationships in connection with the application of fresh start accounting on the
Effective Date. Customer relationships will be amortized on an accelerated method over useful lives of 11-15 years
based on the period over which current customers are expected to generate cash flows.
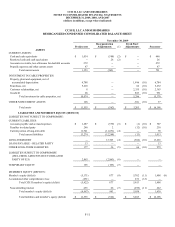
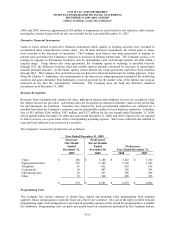
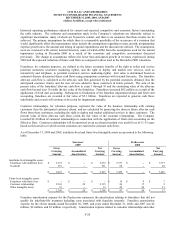
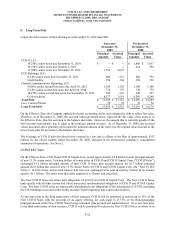
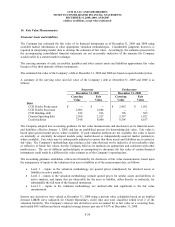
As of December 31, 2009 and 2008, indefinite-lived and finite-lived intangible assets are presented in the following
table:
Successor Predecessor
2009 2008
Gross
Net Gross Net
Carrying Accumulated Carrying Carrying Accumulated Carrying
Amount Amortization Amount Amount Amortization Amount
Indefinite-lived intangible assets:
Franchises with indefinite lives $ 5,272 $ -- $ 5,272 $ 7,377 $ -- $ 7,377
Goodwill 951 -- 951 68 -- 68
$ 6,223 $ -- $ 6,223 $ 7,445 $ -- $ 7,445
Finite-lived intangible assets:
Franchises with finite lives $ -- $ -- $ -- $ 16 $ 9 $ 7
Customer relationships 2,363 28 2,335 26 17 9
Other intangible assets 33 -- 33 45 24 21
$ 2,396 $ 28 $ 2,368 $ 87 $ 50 $ 37
Franchise amortization expense for the Predecessor represents the amortization relating to franchises that did not
qualify for indefinite-life treatment including costs associated with franchise renewals. Franchise amortization
expense for the eleven months ended November 30, 2009, and years ended December 31, 2008, and 2007 was $2
million, $2 million, and $3 million, respectively. Amortization expense related to customer relationships and other