Charter 2009 Annual Report Download - page 39
Download and view the complete annual report
Please find page 39 of the 2009 Charter annual report below. You can navigate through the pages in the report by either clicking on the pages listed below, or by using the keyword search tool below to find specific information within the annual report.-
 1
1 -
2
-
3
-
4
-
5
-
6
-
7
-
8
-
9
-
10
-
11
-
12
-
13
-
14
-
15
-
16
-
17
-
18
-
19
-
20
-
21
-
22
-
23
-
24
-
25
-
26
-
27
-
28
-
 29
29 -
 30
30 -
 31
31 -
 32
32 -
 33
33 -
 34
34 -
 35
35 -
 36
36 -
 37
37 -
 38
38 -
 39
39 -
 40
40 -
 41
41 -
 42
42 -
 43
43 -
 44
44 -
 45
45 -
 46
46 -
 47
47 -
 48
48 -
 49
49 -
50
-
51
-
52
-
53
-
54
-
55
-
56
-
57
-
58
-
59
-
60
-
61
-
62
-
63
-
64
-
65
-
66
-
67
-
68
-
69
-
70
-
71
-
72
-
73
-
74
-
75
-
76
-
77
-
78
-
79
-
80
-
81
-
82
-
83
-
84
-
85
-
86
-
87
-
88
-
89
-
90
 |
 |

36
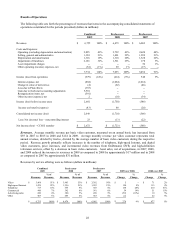
during the period, offset by a decrease of $186 million in cash paid for interest, and revenues increasing at a faster
rate than cash expenses.
Net cash provided by operating activities increased $96 million from $1.1 billion for the year ended December 31,
2007 to $1.2 billion for the year ended December 31, 2008, primarily as a result of revenue growth from high-speed
Internet and telephone driven by bundled services, as well as improved cost efficiencies, offset by an increase of $43
million in interest on cash pay obligations and changes in operating assets and liabilities that provided $29 million
less cash during the same period.
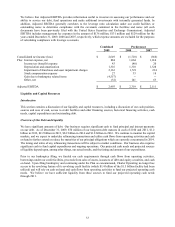
Investing Activities. Net cash used in investing activities was primarily used to purchase property, plant and
equipment and was $1.2 billion for each of the years ended December 31, 2009, 2008 and 2007.
Financing Activities. Net cash used in financing activities was $17 million for the year ended December 31, 2009.
Net cash provided by financing activities was $938 million for the year ended December 31, 2008. The decrease in
cash provided during the year ended December 31, 2009 compared to the corresponding period in 2008 was
primarily the result of no borrowings of long-term debt in 2009.
Net cash provided by financing activities was $938 million and $26 million for the years ended December 31, 2008
and 2007, respectively. The increase in cash provided during the year ended December 31, 2008 compared to the
corresponding period in 2007 was primarily the result of an increase in the amount by which borrowings exceeded
repayments of long-term debt.
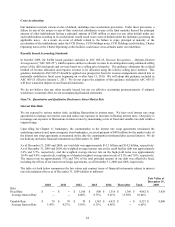
Capital Expenditures
We have significant ongoing capital expenditure requirements. Capital expenditures were $1.1 billion, $1.2 billion,
and $1.2 billion for the years ended December 31, 2009, 2008, and 2007, respectively. See the table below for more
details.
Our capital expenditures are funded primarily from cash flows from operating activities and the issuance of debt. In
addition, our liabilities related to capital expenditures decreased by $10 million, $39 million and $2 million for the
years ended December 31, 2009, 2008 and 2007, respectively.
During 2010, we expect capital expenditures to be approximately $1.2 billion. We expect the nature of these
expenditures will continue to be composed primarily of purchases of customer premise equipment related to
telephone and other advanced services, support capital, and scalable infrastructure. The actual amount of our capital
expenditures depends on the deployment of advanced broadband services and offerings. We may need additional
capital if there is accelerated growth in high-speed Internet, telephone or digital customers or there is an increased
need to respond to competitive pressures by expanding the delivery of other advanced services.
We have adopted capital expenditure disclosure guidance, which was developed by eleven then publicly traded
cable system operators, including Charter, with the support of the National Cable & Telecommunications
Association (“NCTA”). The disclosure is intended to provide more consistency in the reporting of capital
expenditures among peer companies in the cable industry. These disclosure guidelines are not required disclosures
under GAAP, nor do they impact our accounting for capital expenditures under GAAP.
The following table presents our major capital expenditures categories in accordance with NCTA disclosure
guidelines for the years ended December 31, 2009, 2008, and 2007 (dollars in millions):
Combined Predecessor
2009 2008 2007
Customer premise equipment (a) $ 593 $ 595 $ 578
Scalable infrastructure (b) 216 251 232
Line extensions (c) 70 80 105
Upgrade/rebuild (d) 28 40 52
Support capital (e) 227 236 277
Total capital expenditures $ 1,134 $ 1,202 $ 1,244