Charter 2009 Annual Report Download - page 34
Download and view the complete annual report
Please find page 34 of the 2009 Charter annual report below. You can navigate through the pages in the report by either clicking on the pages listed below, or by using the keyword search tool below to find specific information within the annual report.-
 1
1 -
2
-
3
-
4
-
5
-
6
-
7
-
8
-
9
-
10
-
11
-
12
-
13
-
14
-
15
-
16
-
17
-
18
-
19
-
20
-
21
-
22
-
23
-
 24
24 -
 25
25 -
 26
26 -
 27
27 -
 28
28 -
 29
29 -
 30
30 -
 31
31 -
 32
32 -
 33
33 -
 34
34 -
 35
35 -
 36
36 -
 37
37 -
 38
38 -
 39
39 -
 40
40 -
 41
41 -
 42
42 -
 43
43 -
 44
44 -
45
-
46
-
47
-
48
-
49
-
50
-
51
-
52
-
53
-
54
-
55
-
56
-
57
-
58
-
59
-
60
-
61
-
62
-
63
-
64
-
65
-
66
-
67
-
68
-
69
-
70
-
71
-
72
-
73
-
74
-
75
-
76
-
77
-
78
-
79
-
80
-
81
-
82
-
83
-
84
-
85
-
86
-
87
-
88
-
89
-
90
 |
 |

31
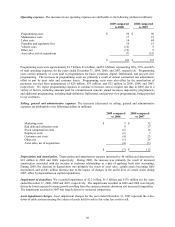
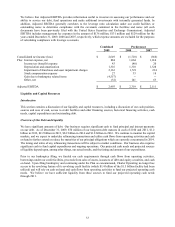
Other operating (income) expenses, net. The changes in other operating (income) expenses, net are attributable to
the following (dollars in millions):
2009 compared
to 2008
2008 compared
to 2007
Increases (decreases) in losses on sales of assets $ (6) $ 16
Increases (decreases) in special charges, net (97) 70
$ (103) $ 86
The decrease in special charges in 2009 as compared to 2008 is the result of favorable litigation settlements in 2009
as compared to unfavorable litigation settlements in 2008. For more information, see Note 15 to the accompanying
consolidated financial statements contained in “Item 8. Financial Statements and Supplementary Data.”
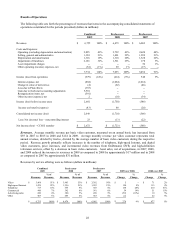
Interest expense, net. Net interest expense decreased by $180 million in 2009 from 2008 and increased by $50
million in 2008 from 2007. The decrease in 2009 compared to 2008 is due to a decrease in the weighted average
interest rate from 7.5% in 2008 to 7.4% in 2009, excluding the effect of interest being calculated at a prime rate
compared to LIBOR and 2% penalty interest, the incremental cost of which is being recorded in reorganization
items, net. The increase in net interest expense from 2007 to 2008 was a result of average debt outstanding
increasing from $11.9 billion in 2007 to $12.8 billion in 2008, offset by a decrease in our average borrowing rate
from 8.1% in 2007 to 7.5% in 2008.
Change in value of derivatives. Interest rate swaps were held to manage our interest costs and reduce our exposure
to increases in floating interest rates. We expensed the change in fair value of derivatives that did not qualify for
hedge accounting and cash flow hedge ineffectiveness on interest rate swap agreements. Upon filing for Chapter 11
bankruptcy, the counterparties to the interest rate swap agreements terminated the underlying contracts and, upon
emergence from bankruptcy, received payment for the market value of the interest rate swap agreement as measured
on the date the counterparties terminated. The loss from the change in value of derivatives increased from $46
million in 2007 to $62 million in 2008 and decreased to $4 million in 2009.
Loss due to Plan effects. Loss due to Plan effects represents the loss recorded as a result of the consummation of
the Plan. For more information, see Note 2 to the accompanying condensed consolidated financial statements
contained in “Item 8. Financial Statements and Supplementary Data.”
Gain due to fresh start accounting adjustments. Upon our emergence from bankruptcy, the Company applied fresh
start accounting. Gain due to fresh start accounting adjustments represents the net gains recognized as a result of
adjusting all assets and liabilities to fair value. For more information, see Note 2 to the accompanying condensed
consolidated financial statements contained in “Item 8. Financial Statements and Supplementary Data.”
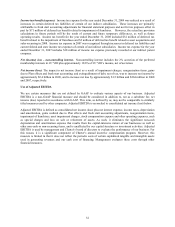
Reorganizations items, net. Reorganization items, net of $591 million for the year ended December 31, 2009
represent items of income, expense, gain or loss that we realized or incurred because we were in reorganization under
Chapter 11 of the Bankruptcy Code. For more information, see Note 16 to the accompanying condensed
consolidated financial statements contained in “Item 8. Financial Statements and Supplementary Data.”
Other income (expense), net. The changes in other income (expense), net are attributable to the following (dollars
in millions):
`
2009 compared
to 2008
2008 compared
to 2007
Change in loss on extinguishment of debt $ 4 $ 28
Change in investment income 2 1
Other, net 6 (5)
$ 12 $ 24
For more information, see Note 17 to the accompanying consolidated financial statements contained in “Item 8.
Financial Statements and Supplementary Data.”