Charter 2009 Annual Report Download - page 58
Download and view the complete annual report
Please find page 58 of the 2009 Charter annual report below. You can navigate through the pages in the report by either clicking on the pages listed below, or by using the keyword search tool below to find specific information within the annual report.-
 1
1 -
2
-
3
-
4
-
5
-
6
-
7
-
8
-
9
-
10
-
11
-
12
-
13
-
14
-
15
-
16
-
17
-
18
-
19
-
20
-
21
-
22
-
23
-
24
-
25
-
26
-
27
-
28
-
29
-
30
-
31
-
32
-
33
-
34
-
35
-
36
-
37
-
38
-
39
-
40
-
41
-
42
-
43
-
44
-
45
-
46
-
47
-
 48
48 -
 49
49 -
 50
50 -
 51
51 -
 52
52 -
 53
53 -
 54
54 -
 55
55 -
 56
56 -
 57
57 -
 58
58 -
 59
59 -
 60
60 -
 61
61 -
 62
62 -
 63
63 -
 64
64 -
 65
65 -
 66
66 -
 67
67 -
 68
68 -
69
-
70
-
71
-
72
-
73
-
74
-
75
-
76
-
77
-
78
-
79
-
80
-
81
-
82
-
83
-
84
-
85
-
86
-
87
-
88
-
89
-
90
 |
 |
CCH II, LLC AND SUBSIDIARIES
NOTES TO CONSOLIDATED FINANCIAL STATEMENTS
DECEMBER 31, 2009, 2008, AND 2007
(dollars in millions, except where indicated)
F-10
constructing or purchasing a new asset with similar utility, then adjusts the value in consideration of all forms of
depreciation as of the appraisal date as described below:
• Physical depreciation — the loss in value or usefulness attributable solely to use of the asset and physical
causes such as wear and tear and exposure to the elements.
• Functional obsolescence — a loss in value is due to factors inherent in the asset itself and due to changes in
technology, design or process resulting in inadequacy, overcapacity, lack of functional utility or excess
operating costs.
• Economic obsolescence — loss in value by unfavorable external conditions such as economics of the
industry or geographic area, or change in ordinances.
The cost approach relies on management’ s assumptions regarding current material and labor costs required to
rebuild and repurchase significant components of the Company’ s property, plant and equipment along with
assumptions regarding the age and estimated useful lives of the Company’ s property, plant and equipment.
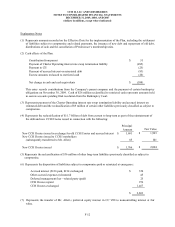
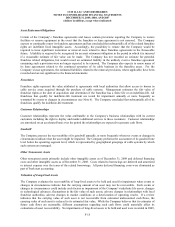
Intangible Assets — The Company identified the following intangible assets to be valued: (i) franchise marketing
rights and (ii) customer relationships.
Franchise marketing rights and customer relationships were valued using an income approach and were valued at
$5.3 billion and $2.4 billion, respectively, as of November 30, 2009. See Note 6 to the consolidated financial
statements for a description of the methods used to value intangible assets.
Long-Term Debt – Long-term debt was valued at fair value using quoted market prices.
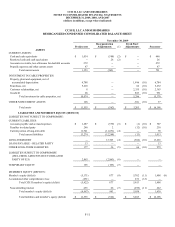
The adjustments presented below are to the Company’ s November 30, 2009 balance sheet. The balance sheet
reorganization adjustments presented below summarize the impact of the Plan and the adoption of fresh start
accounting as of the Effective Date.