Charter 2009 Annual Report Download - page 31
Download and view the complete annual report
Please find page 31 of the 2009 Charter annual report below. You can navigate through the pages in the report by either clicking on the pages listed below, or by using the keyword search tool below to find specific information within the annual report.-
 1
1 -
2
-
3
-
4
-
5
-
6
-
7
-
8
-
9
-
10
-
11
-
12
-
13
-
14
-
15
-
16
-
17
-
18
-
19
-
20
-
 21
21 -
 22
22 -
 23
23 -
 24
24 -
 25
25 -
 26
26 -
 27
27 -
 28
28 -
 29
29 -
 30
30 -
 31
31 -
 32
32 -
 33
33 -
 34
34 -
 35
35 -
 36
36 -
 37
37 -
 38
38 -
 39
39 -
 40
40 -
 41
41 -
42
-
43
-
44
-
45
-
46
-
47
-
48
-
49
-
50
-
51
-
52
-
53
-
54
-
55
-
56
-
57
-
58
-
59
-
60
-
61
-
62
-
63
-
64
-
65
-
66
-
67
-
68
-
69
-
70
-
71
-
72
-
73
-
74
-
75
-
76
-
77
-
78
-
79
-
80
-
81
-
82
-
83
-
84
-
85
-
86
-
87
-
88
-
89
-
90
 |
 |

28
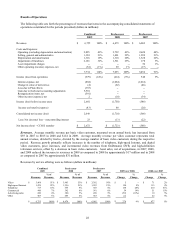
Results of Operations
The following table sets forth the percentages of revenues that items in the accompanying consolidated statements of
operations constituted for the periods presented (dollars in millions):
Combined Predecessor Predecessor
2009 2008 2007
Revenues $ 6,755 100% $ 6,479 100% $ 6,002 100%
Costs and Expenses:
Operating (excluding depreciation and amortization) 2,895 43% 2,792 43% 2,620 44%
Selling, general and administrative 1,394 21% 1,401 22% 1,289 21%
Depreciation and amortization 1,316 19% 1,310 20% 1,328 22%
Impairment of franchises 2,163 32% 1,521 23% 178 3%
Asset impairment charges -- -- -- -- 56 1%
Other operating (income) expenses, net (34) (1%) 69 1% (17) --
7,734 114% 7,093 109% 5,454 91%
Income (loss) from operations (979) (14%) (614) (9%) 548 9%
Interest expense, net (884) (1,064) (1,014)
Change in value of derivatives (4) (62) (46)
Loss due to Plan effects (353) -- --
Gain due to fresh start accounting adjustments 5,501 -- --
Reorganization items, net (591) -- --
Other income (expense), net 2 (10) (34)
Income (loss) before income taxes 2,692 (1,750) (546)
Income tax benefit (expense) (43) 40 (20)
Consolidated net income (loss) 2,649 (1,710) (566)
Less: Net (income) loss – noncontrolling interest 23 (13) (22)
N
et Income (loss) – CCH II member $ 2,672 $ (1,723) $ (588)
Revenues. Average monthly revenue per basic video customer, measured on an annual basis, has increased from
$93 in 2007 to $105 in 2008 and $114 in 2009. Average monthly revenue per video customer represents total
annual revenue, divided by twelve, divided by the average number of basic video customers during the respective
period. Revenue growth primarily reflects increases in the number of telephone, high-speed Internet, and digital
video customers, price increases, and incremental video revenues from OnDemand, DVR, and high-definition
television services, offset by a decrease in basic video customers. Asset sales, net of acquisitions, in 2007, 2008,
and 2009 reduced the increase in revenues in 2009 as compared to 2008 by approximately $17 million and in 2008
as compared to 2007 by approximately $31 million.
Revenues by service offering were as follows (dollars in millions):
Combined Predecessor Predecessor
2009 2008 2007 2009 over 2008 2008 over 2007
Revenues
% of
Revenues
Revenues
% of
Revenues
Revenues
% of
Revenues
Change
%
Change
Change
%
Change
Video $ 3,468 51% $ 3,463 53% $ 3,392 56% $ 5 -- $ 71 2%
High-speed Internet 1,476 22% 1,356 21% 1,243 21% 120 9% 113 9%
Telephone 713 10% 555 9% 345 6% 158 28% 210 61%
Commercial 446 7% 392 6% 341 6% 54 14% 51 15%
Advertising sales 249 4% 308 5% 298 5% (59) (19%) 10 3%
Other 403 6% 405 6% 383 6% (2) -- 22 6%
$ 6,755 100% $ 6,479 100% $ 6,002 100%
$276 4% $ 477 8%