Charter 2009 Annual Report Download - page 36
Download and view the complete annual report
Please find page 36 of the 2009 Charter annual report below. You can navigate through the pages in the report by either clicking on the pages listed below, or by using the keyword search tool below to find specific information within the annual report.-
 1
1 -
2
-
3
-
4
-
5
-
6
-
7
-
8
-
9
-
10
-
11
-
12
-
13
-
14
-
15
-
16
-
17
-
18
-
19
-
20
-
21
-
22
-
23
-
24
-
25
-
 26
26 -
 27
27 -
 28
28 -
 29
29 -
 30
30 -
 31
31 -
 32
32 -
 33
33 -
 34
34 -
 35
35 -
 36
36 -
 37
37 -
 38
38 -
 39
39 -
 40
40 -
 41
41 -
 42
42 -
 43
43 -
 44
44 -
 45
45 -
 46
46 -
47
-
48
-
49
-
50
-
51
-
52
-
53
-
54
-
55
-
56
-
57
-
58
-
59
-
60
-
61
-
62
-
63
-
64
-
65
-
66
-
67
-
68
-
69
-
70
-
71
-
72
-
73
-
74
-
75
-
76
-
77
-
78
-
79
-
80
-
81
-
82
-
83
-
84
-
85
-
86
-
87
-
88
-
89
-
90
 |
 |

33
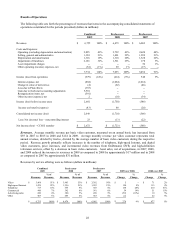
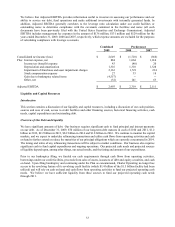
We believe that Adjusted EBITDA provides information useful to investors in assessing our performance and our
ability to service our debt, fund operations and make additional investments with internally generated funds. In
addition, Adjusted EBITDA generally correlates to the leverage ratio calculation under our credit facilities or
outstanding notes to determine compliance with the covenants contained in the facilities and notes (all such
documents have been previously filed with the United States Securities and Exchange Commission). Adjusted
EBITDA includes management fee expenses in the amount of $136 million, $131 million and $129 million for the
years ended December 31, 2009, 2008 and 2007, respectively, which expense amounts are excluded for the purposes
of calculating compliance with leverage covenants.
Combined Predecessor
2009 2008 2007
Consolidated net income (loss) $ 2,649 $ (1,710) $ (566)
Plus: Interest expense, net 884 1,064 1,014
Income tax (benefit) expense 43 (40) 20
Depreciation and amortization 1,316 1,310 1,328
Impairment of franchises and asset impairment charges 2,163 1,521 234
Stock compensation expense 27 33 18
Gain due to bankruptcy related items (4,557) -- --
Other, net (32) 141 63
Adjusted EBITDA $ 2,493 $ 2,319 $ 2,111
Liquidity and Capital Resources
Introduction
This section contains a discussion of our liquidity and capital resources, including a discussion of our cash position,
sources and uses of cash, access to credit facilities and other financing sources, historical financing activities, cash
needs, capital expenditures and outstanding debt.
Overview of Our Debt and Liquidity
We have significant amounts of debt. Our business requires significant cash to fund principal and interest payments
on our debt. As of December 31, 2009, $70 million of our long-term debt matures in each of 2010 and 2011, $1.2
billion in 2012, $2.2 billion in 2013, $8.2 billion in 2014 and $1.8 billion in 2016. We continue to monitor the capital
markets, and we expect to undertake refinancing transactions and utilize cash flows from operating activities and cash
on hand to further extend or reduce the maturities of our principal obligations which are currently concentrated in 2014.
The timing and terms of any refinancing transactions will be subject to market conditions. Our business also requires
significant cash to fund capital expenditures and ongoing operations. Our projected cash needs and projected sources
of liquidity depend upon, among other things, our actual results, and the timing and amount of our expenditures.
Prior to our bankruptcy filing, we funded our cash requirements through cash flows from operating activities,
borrowings under our credit facilities, proceeds from sales of assets, issuances of debt and equity securities, and cash
on hand. Upon filing bankruptcy and continuing under the Plan as consummated, Charter Operating no longer has
access to the revolving feature of its revolving credit facility (which $1.4 billion of the $1.5 billion facility had been
utilized) and will rely on cash on hand and cash flows from operating activities to fund our projected operating cash
needs. We believe we have sufficient liquidity from these sources to fund our projected operating cash needs
through 2011.