Charter 2009 Annual Report Download - page 32
Download and view the complete annual report
Please find page 32 of the 2009 Charter annual report below. You can navigate through the pages in the report by either clicking on the pages listed below, or by using the keyword search tool below to find specific information within the annual report.-
 1
1 -
2
-
3
-
4
-
5
-
6
-
7
-
8
-
9
-
10
-
11
-
12
-
13
-
14
-
15
-
16
-
17
-
18
-
19
-
20
-
21
-
 22
22 -
 23
23 -
 24
24 -
 25
25 -
 26
26 -
 27
27 -
 28
28 -
 29
29 -
 30
30 -
 31
31 -
 32
32 -
 33
33 -
 34
34 -
 35
35 -
 36
36 -
 37
37 -
 38
38 -
 39
39 -
 40
40 -
 41
41 -
 42
42 -
43
-
44
-
45
-
46
-
47
-
48
-
49
-
50
-
51
-
52
-
53
-
54
-
55
-
56
-
57
-
58
-
59
-
60
-
61
-
62
-
63
-
64
-
65
-
66
-
67
-
68
-
69
-
70
-
71
-
72
-
73
-
74
-
75
-
76
-
77
-
78
-
79
-
80
-
81
-
82
-
83
-
84
-
85
-
86
-
87
-
88
-
89
-
90
 |
 |

29
Video revenues consist primarily of revenues from basic and digital video services provided to our non-commercial
customers. Basic video customers decreased by 212,400 and 174,200 customers in 2009 and 2008, respectively, of
which 12,400 in 2009 and 16,700 in 2008 were related to asset sales, net of acquisitions. Digital video customers
increased by 84,700 and 213,000 customers in 2009 and 2008, respectively. The increase in 2009 and 2008 was
reduced by asset sales, net of acquisitions, of 1,200 and 7,600 digital customers, respectively. The increases in
video revenues are attributable to the following (dollars in millions):
2009 compared
to 2008
2008 compared
to 2007
Incremental video services and rate adjustments $ 71 $ 87
Increase in digital video customers 42 77
Decrease in basic video customers (97) (72)
Asset sales, net of acquisitions (11) (21)
$5 $ 71
Residential high-speed Internet customers grew by 187,100 and 192,700 customers in 2009 and 2008, respectively.
The increase in 2008 was reduced by asset sales, net of acquisitions, of 5,600 high-speed Internet customers and the
increase in 2009 included asset acquisitions, net of sales of 400 high-speed Internet customers. The increases in
high-speed Internet revenues from our residential customers are attributable to the following (dollars in millions):
2009 compared
to 2008
2008 compared
to 2007
Increase in high-speed Internet customers $ 88 $ 113
Rate adjustments and service upgrades 34 3
Asset sales, net of acquisitions (2) (3)
$ 120 $ 113
Revenues from telephone services increased by $158 million and $220 million in 2009 and 2008, respectively, as a
result of an increase of 247,100 and 389,500 telephone customers in 2009 and 2008, respectively, including an
increase of $1 million in 2009 related to higher average rates and offset by a decrease of $10 million in 2008 related
to lower average rates.
Commercial revenues consist primarily of revenues from services provided to our commercial customers.
Commercial revenues increased primarily as a result of increased sales of the Charter Business Bundle® primarily
to small and medium-sized businesses. The increases were reduced by approximately $1 million in 2009 and $2
million in 2008 as a result of asset sales.
Advertising sales revenues consist primarily of revenues from commercial advertising customers, programmers and
other vendors. In 2009, advertising sales revenues decreased primarily as a result of significant decreases in
revenues from the political, automotive and retail sectors coupled with a decrease of $2 million related to asset sales.
In 2008, advertising sales revenues increased primarily as a result of increases in political advertising sales and
advertising sales to vendors offset by significant decreases in revenues from the automotive and furniture sectors,
and a decrease of $2 million related to asset sales. For the years ended December 31, 2009, 2008, and 2007, we
received $41 million, $39 million, and $15 million, respectively, in advertising sales revenues from vendors.
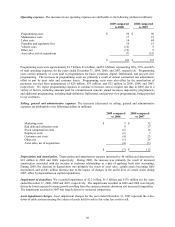
Other revenues consist of franchise fees, regulatory fees, customer installations, home shopping, late payment fees,
wire maintenance fees and other miscellaneous revenues. For the years ended December 31, 2009, 2008, and 2007,
franchise fees represented approximately 45%, 46%, and 46%, respectively, of total other revenues. The decrease in
other revenues in 2009 was primarily the result of decreases in home shopping. The increase in other revenues in
2008 was primarily the result of increases in franchise and other regulatory fees and wire maintenance fees. The
increases were reduced by approximately $1 million in 2009 and $3 million in 2008 as a result of asset sales.