Charter 2009 Annual Report Download - page 90
Download and view the complete annual report
Please find page 90 of the 2009 Charter annual report below. You can navigate through the pages in the report by either clicking on the pages listed below, or by using the keyword search tool below to find specific information within the annual report.-
 1
1 -
2
-
3
-
4
-
5
-
6
-
7
-
8
-
9
-
10
-
11
-
12
-
13
-
14
-
15
-
16
-
17
-
18
-
19
-
20
-
21
-
22
-
23
-
24
-
25
-
26
-
27
-
28
-
29
-
30
-
31
-
32
-
33
-
34
-
35
-
36
-
37
-
38
-
39
-
40
-
41
-
42
-
43
-
44
-
45
-
46
-
47
-
48
-
49
-
50
-
51
-
52
-
53
-
54
-
55
-
56
-
57
-
58
-
59
-
60
-
61
-
62
-
63
-
64
-
65
-
66
-
67
-
68
-
69
-
70
-
71
-
72
-
73
-
74
-
75
-
76
-
77
-
78
-
79
-
 80
80 -
 81
81 -
 82
82 -
 83
83 -
 84
84 -
 85
85 -
 86
86 -
 87
87 -
 88
88 -
 89
89 -
 90
90
 |
 |

CCH II, LLC AND SUBSIDIARIES
NOTES TO CONSOLIDATED FINANCIAL STATEMENTS
DECEMBER 31, 2009, 2008, AND 2007
(dollars in millions, except where indicated)
F-42
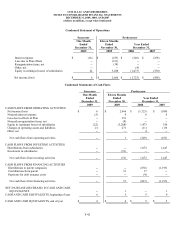
Condensed Statement of Operations
Successor Predecessor
One Month
Ended
December 31,
Eleven Months
Ended
November 30,
Year Ended
December 31,
2009 2009 2008 2007
Interest expense $ (16) $ (233) $ (246) $ (238)
Loss due to Plan effects -- (351) -- --
Reorganization items, net -- (38) -- --
Other, net -- -- (4) --
Equity in earnings (losses) of subsidiaries 22 3,288 (1,473) (350)
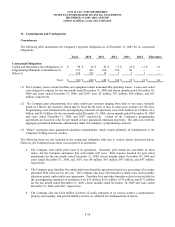
N
et income (loss) $ 6 $ 2,666 $ (1,723) $ (588)
Condensed Statements of Cash Flows
Successor Predecessor
One Month
Ended
December 31,
Eleven Months
Ended
November 30,
Year Ended
December 31,
2009 2009 2008 2007
CASH FLOWS FROM OPERATING ACTIVITIES:
Net income (loss) $ 6 $ 2,666 $ (1,723) $ (588)
Noncash interest expense (5) 9 8 6
Loss due to effects of Plan -- 351 -- --
Noncash reorganization items, net -- (8) -- --
Equity in (earnings) losses of subsidiaries (22) (3,288) 1,473 350
Changes in operating assets and liabilities 21 271 (11) (19)
Other, net -- -- 4 --
Net cash flows from operating activities -- 1 (249) (251)
CASH FLOWS FROM INVESTING ACTIVITIES:
Distributions from subsidiaries -- -- 1,072 1,447
Investment in subsidiaries -- (51) -- --
Net cash flows from investing activities -- (51) 1,072 1,447
CASH FLOWS FROM FINANCING ACTIVITIES
Distributions to parent companies -- -- (836) (1,195)
Contributions from parent -- 51 17 --
Payments for debt issuance costs -- -- (4) --
Net cash flows from financing activities -- 51 (823) (1,195)
N
ET INCREASE (DECREASE) IN CASH AND CASH
EQUIVALENTS
--
1 -- 1
CASH AND CASH EQUIVALENTS, beginning of year 6 5 5 4
CASH AND CASH EQUIVALENTS, end of year $ 6 $ 6 $ 5 $ 5