Charter 2015 Annual Report Download - page 10
Download and view the complete annual report
Please find page 10 of the 2015 Charter annual report below. You can navigate through the pages in the report by either clicking on the pages listed below, or by using the keyword search tool below to find specific information within the annual report.-
 1
1 -
 2
2 -
 3
3 -
 4
4 -
 5
5 -
 6
6 -
 7
7 -
 8
8 -
 9
9 -
 10
10 -
 11
11 -
 12
12 -
 13
13 -
 14
14 -
 15
15 -
 16
16 -
 17
17 -
 18
18 -
 19
19 -
 20
20 -
 21
21 -
22
-
23
-
24
-
25
-
26
-
27
-
28
-
29
-
30
-
31
-
32
-
33
-
34
-
35
-
36
-
37
-
38
-
39
-
40
-
41
-
42
-
43
-
44
-
45
-
46
-
47
-
48
-
49
-
50
-
51
-
52
-
53
-
54
-
55
-
56
-
57
-
58
-
59
-
60
-
61
-
62
-
63
-
64
-
65
-
66
-
67
-
68
-
69
-
70
-
71
-
72
-
73
-
74
-
75
-
76
-
77
-
78
-
79
-
80
-
81
-
82
-
83
-
84
-
85
-
86
-
87
-
88
-
89
-
90
-
91
-
92
-
93
-
94
-
95
-
96
-
97
-
98
-
99
-
100
-
101
-
102
-
103
-
104
-
105
-
106
-
107
-
108
-
109
-
110
-
111
-
112
-
113
-
114
-
115
-
116
-
117
-
118
-
119
-
120
-
121
-
122
-
123
-
124
-
125
-
126
-
127
-
128
-
129
-
130
-
131
-
132
-
133
-
134
-
135
-
136
-
137
-
138
-
139
-
140
-
141
-
142
-
143
-
144
-
145
-
146
-
147
-
148
-
149
-
150
-
151
-
152
 |
 |

8
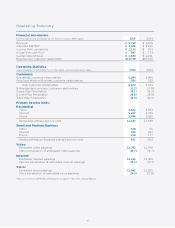
Financial Information
For the year ended December 31, (in millions, except ARPU data)
Revenue
Adjusted EBITDA*
Income from operations
Actual free cash flow*
Capital expenditures
Revenue per customer relationship
Operating Statistics
Approximate as of December 31, (in thousands, except penetration data)
Customers:
Residential customer relationships
Small and Medium Business customer relationships
Total customer relationships
% Residential non-video customer relationships
Single Play Penetration
Double Play Penetration
Triple Play Penetration
Primary Service Units:
Residential
Video
Internet
Phone
Residential primary service units
Small and Medium Business
Video
Internet
Phone
Small and Medium Business primary service units
Video:
Estimated video passings
Video penetration of estimated video passings
Internet:
Estimated Internet passings
Internet penetration of estimated Internet passings
Voice:
Estimated voice passings
Voice penetration of estimated voice passings
*See use of Non-GAAP Financial Measures on page F- 50 of this Annual Report.
Operating Summary