Charter 2015 Annual Report Download - page 147
Download and view the complete annual report
Please find page 147 of the 2015 Charter annual report below. You can navigate through the pages in the report by either clicking on the pages listed below, or by using the keyword search tool below to find specific information within the annual report.-
 1
1 -
2
-
3
-
4
-
5
-
6
-
7
-
8
-
9
-
10
-
11
-
12
-
13
-
14
-
15
-
16
-
17
-
18
-
19
-
20
-
21
-
22
-
23
-
24
-
25
-
26
-
27
-
28
-
29
-
30
-
31
-
32
-
33
-
34
-
35
-
36
-
37
-
38
-
39
-
40
-
41
-
42
-
43
-
44
-
45
-
46
-
47
-
48
-
49
-
50
-
51
-
52
-
53
-
54
-
55
-
56
-
57
-
58
-
59
-
60
-
61
-
62
-
63
-
64
-
65
-
66
-
67
-
68
-
69
-
70
-
71
-
72
-
73
-
74
-
75
-
76
-
77
-
78
-
79
-
80
-
81
-
82
-
83
-
84
-
85
-
86
-
87
-
88
-
89
-
90
-
91
-
92
-
93
-
94
-
95
-
96
-
97
-
98
-
99
-
100
-
101
-
102
-
103
-
104
-
105
-
106
-
107
-
108
-
109
-
110
-
111
-
112
-
113
-
114
-
115
-
116
-
117
-
118
-
119
-
120
-
121
-
122
-
123
-
124
-
125
-
126
-
127
-
128
-
129
-
130
-
131
-
132
-
133
-
134
-
135
-
136
-
 137
137 -
 138
138 -
 139
139 -
 140
140 -
 141
141 -
 142
142 -
 143
143 -
 144
144 -
 145
145 -
 146
146 -
 147
147 -
 148
148 -
 149
149 -
 150
150 -
 151
151 -
 152
152
 |
 |
The Company uses certain measures that are
not defined by Generally Accepted Accounting
Principles (“GAAP”) to evaluate various aspects
of its business. Adjusted EBITDA, adjusted
EBITDA less capital expenditures, and free cash
flow are non-GAAP financial measures and
should be considered in addition to, not as a
substitute for, net income (loss) or cash flows
from operating activities reported in accor-
dance with GAAP. These terms, as defined by
Charter, may not be comparable to similarly
titled measures used by other companies.
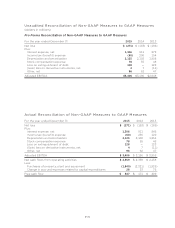
Adjusted EBITDA is reconciled to net income
(loss) and free cash flow is reconciled to net
cash flows from operating activities in this
annual report.
Adjusted EBITDA is defined as net income
(loss) plus net interest expense, income taxes,
depreciation and amortization, stock compen-
sation expense, loss on extinguishment of debt,
(gain) loss on derivative instruments, net, other
expense, net and other operating expenses,
such as merger and acquisition costs, special
charges and (gain) loss on sale or retirement
of assets. As such, it eliminates the significant
non-cash depreciation and amortization expense
that results from the capital-intensive nature
of the Company’s businesses as well as other
non-cash or special items, and is unaffected by
the Company’s capital structure or investment
activities. However, this measure is limited in that
it does not reflect the periodic costs of certain
capitalized tangible and intangible assets used
in generating revenues and the cash cost of
financing. These costs are evaluated through
other financial measures.
Free cash flow is defined as net cash flows from
operating activities, less purchases of property,
plant and equipment and changes in accrued
expenses related to capital expenditures.
Management and the Company’s Board use
adjusted EBITDA and free cash flow to assess
Charter’s performance and its ability to service
its debt, fund operations and make additional
investments with internally generated funds.
In addition, adjusted EBITDA generally corre-
lates to the leverage ratio calculation under the
Company’s credit facilities or outstanding notes
to determine compliance with the covenants
contained in the credit facilities and notes
(all such documents have been previously filed
with the United States Securities and Exchange
Commission). For the purpose of calculating
compliance with leverage covenants, we use
adjusted EBITDA, as presented, excluding
certain expenses paid by our operating sub-
sidiaries to other Charter entities. Our debt
covenants refer to these expenses as manage-
ment fees which fees were in the amount of
$322 million, $253 million and $201 million for
the years ended December 31, 2015, 2014 and
2013, respectively.
In addition to the actual results for the years
ended December 31, 2015, 2014 and 2013, we
have provided pro forma results in this annual
report for the year ended December 31, 2013.
We believe these pro forma results facilitate
meaningful analysis of the results of operations.
Pro forma results in this annual report reflect
certain acquisitions and sales of cable systems
in 2013 as if they occurred as of January 1, 2012.
Use of Non-GAAP Financial Measures
F-50