Charter 2015 Annual Report Download - page 142
Download and view the complete annual report
Please find page 142 of the 2015 Charter annual report below. You can navigate through the pages in the report by either clicking on the pages listed below, or by using the keyword search tool below to find specific information within the annual report.-
 1
1 -
2
-
3
-
4
-
5
-
6
-
7
-
8
-
9
-
10
-
11
-
12
-
13
-
14
-
15
-
16
-
17
-
18
-
19
-
20
-
21
-
22
-
23
-
24
-
25
-
26
-
27
-
28
-
29
-
30
-
31
-
32
-
33
-
34
-
35
-
36
-
37
-
38
-
39
-
40
-
41
-
42
-
43
-
44
-
45
-
46
-
47
-
48
-
49
-
50
-
51
-
52
-
53
-
54
-
55
-
56
-
57
-
58
-
59
-
60
-
61
-
62
-
63
-
64
-
65
-
66
-
67
-
68
-
69
-
70
-
71
-
72
-
73
-
74
-
75
-
76
-
77
-
78
-
79
-
80
-
81
-
82
-
83
-
84
-
85
-
86
-
87
-
88
-
89
-
90
-
91
-
92
-
93
-
94
-
95
-
96
-
97
-
98
-
99
-
100
-
101
-
102
-
103
-
104
-
105
-
106
-
107
-
108
-
109
-
110
-
111
-
112
-
113
-
114
-
115
-
116
-
117
-
118
-
119
-
120
-
121
-
122
-
123
-
124
-
125
-
126
-
127
-
128
-
129
-
130
-
131
-
 132
132 -
 133
133 -
 134
134 -
 135
135 -
 136
136 -
 137
137 -
 138
138 -
 139
139 -
 140
140 -
 141
141 -
 142
142 -
 143
143 -
 144
144 -
 145
145 -
 146
146 -
 147
147 -
 148
148 -
 149
149 -
 150
150 -
 151
151 -
 152
152
 |
 |

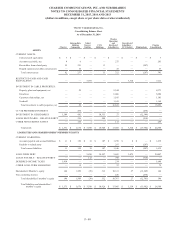
CHARTER COMMUNICATIONS, INC. AND SUBSIDIARIES
NOTES TO CONSOLIDATED FINANCIAL STATEMENTS
DECEMBER 31, 2015, 2014 AND 2013
(dollars in millions, except share or per share data or where indicated)
F- 45
Charter Communications, Inc.
Consolidating Statement of Cash Flows
For the year ended December 31, 2015
Charter
Intermediate
Holding
Companies
Safari
Escrow
Entities
CCO
Holdings
Charter
Operating
and
Restricted
Subsidiaries
Unrestricted
Subsidiary -
CCO Safari Eliminations
Charter
Consolidated
CASH FLOWS FROM OPERATING
ACTIVITIES:
Consolidated net income (loss) $ (271) $ (167) $ (476) $ 308 $ 1,119 $ (50)$ (734) $ (271)
Adjustments to reconcile net income (loss) to
net cash flows from operating activities:
Depreciation and amortization — — — — 2,125 — — 2,125
Noncash interest expense — — — 16 12 — — 28
Loss on extinguishment of debt — — 2 123 — 3 — 128
Loss on derivative instruments, net — — — — 4 — — 4
Deferred income taxes 149 — — — (214) — — (65)
Equity in (income) losses of subsidiaries 121 168 — (1,073) 50 — 734 —
Other, net — 7 — — 82 — — 89
Changes in operating assets and liabilities, net
of effects from acquisitions and dispositions:
Accounts receivable (4) (1) — — 10 — — 5
Prepaid expenses and other assets — 2 — — (5)—— (3)
Accounts payable, accrued liabilities and
other — 68 265 (23)17 (8) — 319
Receivables from and payables to related
party 4 (82) 17 (14)75 — — —
Net cash flows from operating activities (1) (5) (192)(663) 3,275 (55) — 2,359
CASH FLOWS FROM INVESTING ACTIVITIES:
Purchases of property, plant and equipment — — — — (1,840) — — (1,840)
Change in accrued expenses related to capital
expenditures — — — — 28 — — 28
Contribution to subsidiary (20) (90) — (46)(24) — 180 —
Distributions from subsidiary 26 376 — 715 — — (1,117)—
Change in restricted cash and cash equivalents — — (18,667) — — 3,514 — (15,153)
Other, net — (55) — — (12) — — (67)
Net cash flows from investing activities 6 231 (18,667) 669 (1,848) 3,514 (937) (17,032)
CASH FLOWS FROM FINANCING ACTIVITIES:
Borrowings of long-term debt — — 21,790 2,700 1,555 — — 26,045
Repayments of long-term debt — — (3,500)(2,598)(1,745)(3,483) — (11,326)
Borrowings (payments) loans payable - related
parties — — 581 (18)(563)—— —
Payment for debt issuance costs — — (12)(24) — — — (36)
Purchase of treasury stock (38) — — — — — — (38)
Proceeds from exercise of options 30 — — — — — — 30
Contributions from parent — 95 — 15 46 24 (180)—
Distributions to parent — (321) — (81)(715) — 1,117 —
Other, net — — — — — — — —
Net cash flows from financing activities (8) (226) 18,859 (6)(1,422)(3,459) 937 14,675
NET INCREASE (DECREASE) IN CASH AND
CASH EQUIVALENTS (3) — — — 5 — — 2
CASH AND CASH EQUIVALENTS, beginning of
period 3———— —— 3
CASH AND CASH EQUIVALENTS, end of period $ — $ — $ — $ — $ 5 $ — $ — $ 5