Charter 2015 Annual Report Download - page 67
Download and view the complete annual report
Please find page 67 of the 2015 Charter annual report below. You can navigate through the pages in the report by either clicking on the pages listed below, or by using the keyword search tool below to find specific information within the annual report.-
 1
1 -
2
-
3
-
4
-
5
-
6
-
7
-
8
-
9
-
10
-
11
-
12
-
13
-
14
-
15
-
16
-
17
-
18
-
19
-
20
-
21
-
22
-
23
-
24
-
25
-
26
-
27
-
28
-
29
-
30
-
31
-
32
-
33
-
34
-
35
-
36
-
37
-
38
-
39
-
40
-
41
-
42
-
43
-
44
-
45
-
46
-
47
-
48
-
49
-
50
-
51
-
52
-
53
-
54
-
55
-
56
-
 57
57 -
 58
58 -
 59
59 -
 60
60 -
 61
61 -
 62
62 -
 63
63 -
 64
64 -
 65
65 -
 66
66 -
 67
67 -
 68
68 -
 69
69 -
 70
70 -
 71
71 -
 72
72 -
 73
73 -
 74
74 -
 75
75 -
 76
76 -
 77
77 -
78
-
79
-
80
-
81
-
82
-
83
-
84
-
85
-
86
-
87
-
88
-
89
-
90
-
91
-
92
-
93
-
94
-
95
-
96
-
97
-
98
-
99
-
100
-
101
-
102
-
103
-
104
-
105
-
106
-
107
-
108
-
109
-
110
-
111
-
112
-
113
-
114
-
115
-
116
-
117
-
118
-
119
-
120
-
121
-
122
-
123
-
124
-
125
-
126
-
127
-
128
-
129
-
130
-
131
-
132
-
133
-
134
-
135
-
136
-
137
-
138
-
139
-
140
-
141
-
142
-
143
-
144
-
145
-
146
-
147
-
148
-
149
-
150
-
151
-
152
 |
 |

52
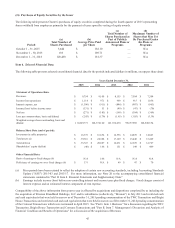
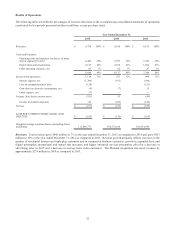
Results of Operations
The following table sets forth the percentages of revenues that items in the accompanying consolidated statements of operations
constituted for the periods presented (dollars in millions, except per share data):
Year Ended December 31,
2015 2014 2013
Revenues $ 9,754 100% $ 9,108 100% $ 8,155 100%
Costs and Expenses:
Operating costs and expenses (exclusive of items
shown separately below) 6,426 66% 5,973 66% 5,345 66%
Depreciation and amortization 2,125 22% 2,102 23% 1,854 23%
Other operating expenses, net 89 1% 62 1% 47 1%
8,640 89% 8,137 89% 7,246 89%
Income from operations 1,114 11% 971 11% 909 11%
Interest expense, net (1,306) (911) (846)
Loss on extinguishment of debt (128) — (123)
Gain (loss) on derivative instruments, net (4) (7) 11
Other expense, net (7) — —
Income (loss) before income taxes (331) 53 (49)
Income tax benefit (expense) 60 (236) (120)
Net loss $ (271) $ (183) $ (169)
LOSS PER COMMON SHARE, BASIC AND
DILUTED: $ (2.43) $ (1.70) $ (1.65)
Weighted average common shares outstanding, basic
and diluted 111,869,771 108,374,160 101,934,630
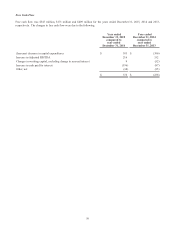
Revenues. Total revenues grew $646 million or 7% in the year ended December 31, 2015 as compared to 2014 and grew $953
million or 12% in the year ended December 31, 2014 as compared to 2013. Revenue growth primarily reflects increases in the
number of residential Internet and triple play customers and in commercial business customers, growth in expanded basic and
digital penetration, promotional and annual rate increases, and higher advanced services penetration offset by a decrease in
advertising sales in 2015 and a decrease in average basic video customers. The Bresnan Acquisition increased revenues by
approximately $276 million in 2014 as compared to 2013.