Charter 2015 Annual Report Download - page 72
Download and view the complete annual report
Please find page 72 of the 2015 Charter annual report below. You can navigate through the pages in the report by either clicking on the pages listed below, or by using the keyword search tool below to find specific information within the annual report.-
 1
1 -
2
-
3
-
4
-
5
-
6
-
7
-
8
-
9
-
10
-
11
-
12
-
13
-
14
-
15
-
16
-
17
-
18
-
19
-
20
-
21
-
22
-
23
-
24
-
25
-
26
-
27
-
28
-
29
-
30
-
31
-
32
-
33
-
34
-
35
-
36
-
37
-
38
-
39
-
40
-
41
-
42
-
43
-
44
-
45
-
46
-
47
-
48
-
49
-
50
-
51
-
52
-
53
-
54
-
55
-
56
-
57
-
58
-
59
-
60
-
61
-
 62
62 -
 63
63 -
 64
64 -
 65
65 -
 66
66 -
 67
67 -
 68
68 -
 69
69 -
 70
70 -
 71
71 -
 72
72 -
 73
73 -
 74
74 -
 75
75 -
 76
76 -
 77
77 -
 78
78 -
 79
79 -
 80
80 -
 81
81 -
 82
82 -
83
-
84
-
85
-
86
-
87
-
88
-
89
-
90
-
91
-
92
-
93
-
94
-
95
-
96
-
97
-
98
-
99
-
100
-
101
-
102
-
103
-
104
-
105
-
106
-
107
-
108
-
109
-
110
-
111
-
112
-
113
-
114
-
115
-
116
-
117
-
118
-
119
-
120
-
121
-
122
-
123
-
124
-
125
-
126
-
127
-
128
-
129
-
130
-
131
-
132
-
133
-
134
-
135
-
136
-
137
-
138
-
139
-
140
-
141
-
142
-
143
-
144
-
145
-
146
-
147
-
148
-
149
-
150
-
151
-
152
 |
 |

57
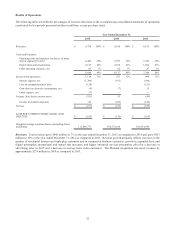
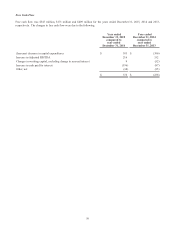
Net loss. We incurred net loss of $271 million, $183 million and $169 million for the years ended December 31, 2015, 2014 and
2013, respectively, primarily as a result of the factors described above.
Loss per common share. During 2015 and 2014, net loss per common share increased by $0.73 and $0.05, respectively, as a result
of the factors described above.
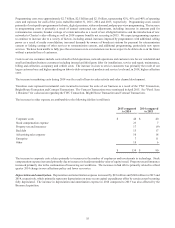
Use of Adjusted EBITDA and Free Cash Flow
We use certain measures that are not defined by GAAP to evaluate various aspects of our business. Adjusted EBITDA and free
cash flow are non-GAAP financial measures and should be considered in addition to, not as a substitute for, net loss and net cash
flows from operating activities reported in accordance with GAAP. These terms, as defined by us, may not be comparable to
similarly titled measures used by other companies. Adjusted EBITDA and free cash flow are reconciled to net loss and net cash
flows from operating activities, respectively, below.
Adjusted EBITDA is defined as net loss plus net interest expense, income taxes, depreciation and amortization, stock compensation
expense, loss on extinguishment of debt, (gain) loss on derivative instruments, net, other expense, net and other operating expenses,
such as merger and acquisition costs, special charges and (gain) loss on sale or retirement of assets. As such, it eliminates the
significant non-cash depreciation and amortization expense that results from the capital-intensive nature of our businesses as well
as other non-cash or special items, and is unaffected by our capital structure or investment activities. Adjusted EBITDA is used
by management and Charter’s board of directors to evaluate the performance of our business. However, this measure is limited
in that it does not reflect the periodic costs of certain capitalized tangible and intangible assets used in generating revenues and
our cash cost of financing. Management evaluates these costs through other financial measures.
Free cash flow is defined as net cash flows from operating activities, less capital expenditures and changes in accrued expenses
related to capital expenditures.
We believe that Adjusted EBITDA and free cash flow provide information useful to investors in assessing our performance and
our ability to service our debt, fund operations and make additional investments with internally generated funds. In addition,
Adjusted EBITDA generally correlates to the leverage ratio calculation under our credit facilities or outstanding notes to determine
compliance with the covenants contained in the facilities and notes (all such documents have been previously filed with the United
States Securities and Exchange Commission). For the purpose of calculating compliance with leverage covenants, we use Adjusted
EBITDA, as presented, excluding certain expenses paid by our operating subsidiaries to other Charter entities. Our debt covenants
refer to these expenses as management fees, which fees were in the amount of $322 million, $253 million and $201 million for
the years ended December 31, 2015, 2014 and 2013, respectively.
Years ended December 31,
2015 2014 2013
Net loss $ (271)$ (183)$ (169)
Plus: Interest expense, net 1,306 911 846
Income tax (benefit) expense (60) 236 120
Depreciation and amortization 2,125 2,102 1,854
Stock compensation expense 78 55 48
Loss on extinguishment of debt 128 — 123
(Gain) loss on derivative instruments, net 4 7 (11)
Other, net 96 62 47
Adjusted EBITDA $ 3,406 $ 3,190 $ 2,858
Net cash flows from operating activities $ 2,359 $ 2,359 $ 2,158
Less: Purchases of property, plant and equipment (1,840)(2,221)(1,825)
Change in accrued expenses related to capital expenditures 28 33 76
Free cash flow $ 547 $ 171 $ 409