Charter 2015 Annual Report Download - page 61
Download and view the complete annual report
Please find page 61 of the 2015 Charter annual report below. You can navigate through the pages in the report by either clicking on the pages listed below, or by using the keyword search tool below to find specific information within the annual report.-
 1
1 -
2
-
3
-
4
-
5
-
6
-
7
-
8
-
9
-
10
-
11
-
12
-
13
-
14
-
15
-
16
-
17
-
18
-
19
-
20
-
21
-
22
-
23
-
24
-
25
-
26
-
27
-
28
-
29
-
30
-
31
-
32
-
33
-
34
-
35
-
36
-
37
-
38
-
39
-
40
-
41
-
42
-
43
-
44
-
45
-
46
-
47
-
48
-
49
-
50
-
 51
51 -
 52
52 -
 53
53 -
 54
54 -
 55
55 -
 56
56 -
 57
57 -
 58
58 -
 59
59 -
 60
60 -
 61
61 -
 62
62 -
 63
63 -
 64
64 -
 65
65 -
 66
66 -
 67
67 -
 68
68 -
 69
69 -
 70
70 -
 71
71 -
72
-
73
-
74
-
75
-
76
-
77
-
78
-
79
-
80
-
81
-
82
-
83
-
84
-
85
-
86
-
87
-
88
-
89
-
90
-
91
-
92
-
93
-
94
-
95
-
96
-
97
-
98
-
99
-
100
-
101
-
102
-
103
-
104
-
105
-
106
-
107
-
108
-
109
-
110
-
111
-
112
-
113
-
114
-
115
-
116
-
117
-
118
-
119
-
120
-
121
-
122
-
123
-
124
-
125
-
126
-
127
-
128
-
129
-
130
-
131
-
132
-
133
-
134
-
135
-
136
-
137
-
138
-
139
-
140
-
141
-
142
-
143
-
144
-
145
-
146
-
147
-
148
-
149
-
150
-
151
-
152
 |
 |
46
Item 7. Management’s Discussion and Analysis of Financial Condition and Results of Operations.
Reference is made to “Part I. Item 1A. Risk Factors” and “Cautionary Statement Regarding Forward-Looking Statements,” which
describe important factors that could cause actual results to differ from expectations and non-historical information contained
herein. In addition, the following discussion should be read in conjunction with the audited consolidated financial statements and
accompanying notes thereto of Charter Communications, Inc. and subsidiaries included in “Part II. Item 8. Financial Statements
and Supplementary Data.”
Overview
We are a cable operator providing services in the United States with approximately 6.7 million residential and small and medium
business customers at December 31, 2015. We offer our customers traditional cable video programming, Internet services, and
voice services, as well as advanced video services such as video on demand, HD television and DVR service. We also sell local
advertising on cable networks and provide fiber connectivity to cellular towers and office buildings. See “Part I. Item 1. Business
— Products and Services” for further description of these services, including customer statistics for different services.
Our most significant competitors are direct broadcast satellite providers and certain telephone companies that offer services that
provide features and functions similar to our Internet, video and voice services, including in some cases wireless services, and
they also offer these services in bundles similar to ours. Customers have been more willing to consider our competitors' products,
partially because of continued marketing highlighting perceived differences between competitive video products, especially when
those competitors are often offering significant incentives to switch providers. Some consumers have chosen to receive video over
the Internet rather than through pay television services including from us. See “Part I. Item 1. Business — Competition.” In the
recent past, we have grown revenues by offsetting basic video customer losses with price increases and sales of incremental services
such as Internet, video on demand, DVR and HD television. We expect to continue to grow revenues by increasing the number
of products in our current customer homes, obtaining new customers with our value offering and reducing churn. In addition, we
expect to increase revenues by expanding the sales of services to our commercial customers. However, we cannot assure you that
we will be able to grow revenues or maintain our margins at recent historical rates.
Our business plans include goals for increasing customers and revenue. To reach our goals, we actively invest in our network and
operations, and improve the quality and value of the products and packages that we offer. We have enhanced our video product
by moving to an all-digital platform, offering more HD channels and increasing digital and HD-DVR penetration. We simplified
our offers and pricing, and package our products with the objective of bringing more value to new and existing customers than
our competitors. As part of our effort to create more value for customers, we focus on driving penetration of our triple play offering,
which includes more than 200 HD channels in most of our markets, video on demand, Internet service, and fully-featured voice
service. In addition, we have fully insourced our direct sales workforce and are increasingly insourcing our field operations and
call center workforces and modifying the way our sales workforce is compensated, which we believe positions us for better
customer service and growth. We believe that our enhanced product set combined with improved customer service has lead to
lower customer churn and longer customer lifetimes, allowing us to grow our customer base and revenue more quickly and
economically.
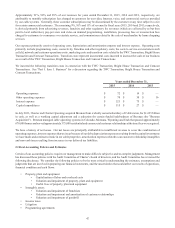
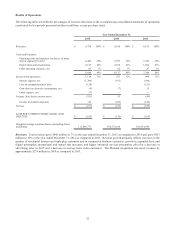
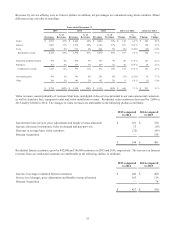
Total revenue growth was 7% for the year ended December 31, 2015 compared to the corresponding period in 2014, and 12% for
the year ended December 31, 2014 compared to the corresponding period in 2013, due to growth in our video, Internet and
commercial businesses. Total revenue growth on a pro forma basis for the acquisition of Bresnan as if it had occurred on January
1, 2012 was 8% for the year ended December 31, 2014 compared to the corresponding period in 2013. For the years ended
December 31, 2015, 2014 and 2013, Adjusted EBITDA was $3.4 billion, $3.2 billion and $2.9 billion, respectively. Adjusted
EBITDA is defined as net loss plus net interest expense, income tax expense, depreciation and amortization, stock compensation
expense, loss on extinguishment of debt, gain (loss) on derivative instruments, net, other expense, net and other operating expenses,
such as merger and acquisition costs, special charges and (gain) loss on sale or retirement of assets. See “—Use of Adjusted
EBITDA and Free Cash Flow” for further information on Adjusted EBITDA. Adjusted EBITDA increased 7% for the year ended
December 31, 2015 compared to the corresponding period in 2014 and 12% for the year ended December 31, 2014 compared to
the corresponding period in 2013 as a result of an increase in residential and commercial revenues offset by increases in programming
costs, transition costs and other operating costs. Adjusted EBITDA growth on a pro forma basis for the acquisition of Bresnan as
if it had occurred on January 1, 2012 was 8% for the year ended December 31, 2014 compared to the corresponding period in
2013. For the years ended December 31, 2015, 2014 and 2013, our income from operations was $1.1 billion, $971 million and
$909 million, respectively. In addition to the factors discussed above, income from operations was affected by increases in other
operating expenses such as merger and acquisition costs as well as increases in depreciation and amortization and stock
compensation expense.