Charter 2015 Annual Report Download - page 64
Download and view the complete annual report
Please find page 64 of the 2015 Charter annual report below. You can navigate through the pages in the report by either clicking on the pages listed below, or by using the keyword search tool below to find specific information within the annual report.-
 1
1 -
2
-
3
-
4
-
5
-
6
-
7
-
8
-
9
-
10
-
11
-
12
-
13
-
14
-
15
-
16
-
17
-
18
-
19
-
20
-
21
-
22
-
23
-
24
-
25
-
26
-
27
-
28
-
29
-
30
-
31
-
32
-
33
-
34
-
35
-
36
-
37
-
38
-
39
-
40
-
41
-
42
-
43
-
44
-
45
-
46
-
47
-
48
-
49
-
50
-
51
-
52
-
53
-
 54
54 -
 55
55 -
 56
56 -
 57
57 -
 58
58 -
 59
59 -
 60
60 -
 61
61 -
 62
62 -
 63
63 -
 64
64 -
 65
65 -
 66
66 -
 67
67 -
 68
68 -
 69
69 -
 70
70 -
 71
71 -
 72
72 -
 73
73 -
 74
74 -
75
-
76
-
77
-
78
-
79
-
80
-
81
-
82
-
83
-
84
-
85
-
86
-
87
-
88
-
89
-
90
-
91
-
92
-
93
-
94
-
95
-
96
-
97
-
98
-
99
-
100
-
101
-
102
-
103
-
104
-
105
-
106
-
107
-
108
-
109
-
110
-
111
-
112
-
113
-
114
-
115
-
116
-
117
-
118
-
119
-
120
-
121
-
122
-
123
-
124
-
125
-
126
-
127
-
128
-
129
-
130
-
131
-
132
-
133
-
134
-
135
-
136
-
137
-
138
-
139
-
140
-
141
-
142
-
143
-
144
-
145
-
146
-
147
-
148
-
149
-
150
-
151
-
152
 |
 |
49
fluctuations in the fair value of such assets, adverse changes in relationships with local franchise authorities, adverse changes in
market conditions, or a deterioration of current or expected future operating results. A long-lived asset is deemed impaired when
the carrying amount of the asset exceeds the projected undiscounted future cash flows associated with the asset. No impairments
of long-lived assets to be held and used were recorded in the years ended December 31, 2015, 2014 and 2013.
We utilize the cost approach as the primary method used to establish fair value for our property, plant and equipment in connection
with business combinations. The cost approach considers the amount required to replace an asset by constructing or purchasing
a new asset with similar utility, then adjusts the value in consideration of physical depreciation and functional and economic
obsolescence as of the appraisal date. The cost approach relies on management’s assumptions regarding current material and labor
costs required to rebuild and repurchase significant components of our property, plant and equipment along with assumptions
regarding the age and estimated useful lives of our property, plant and equipment.
Useful lives of property, plant and equipment. We evaluate the appropriateness of estimated useful lives assigned to our property,
plant and equipment, based on annual analysis of such useful lives, and revise such lives to the extent warranted by changing facts
and circumstances. Any changes in estimated useful lives as a result of this analysis are reflected prospectively beginning in the
period in which the study is completed. Our analysis of useful lives in 2015 did not indicate a change in useful lives. The effect
of a one-year decrease in the weighted average remaining useful life of our property, plant and equipment as of December 31,
2015 would be an increase in annual depreciation expense of approximately $251 million. The effect of a one-year increase in
the weighted average remaining useful life of our property, plant and equipment as of December 31, 2015 would be a decrease in
annual depreciation expense of approximately $235 million.
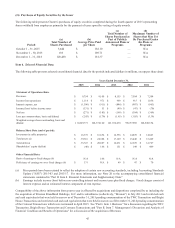
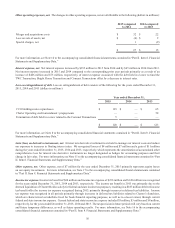
Depreciation expense related to property, plant and equipment totaled $1.9 billion, $1.8 billion and $1.6 billion for the years ended
December 31, 2015, 2014 and 2013, respectively, representing approximately 21%, 22% and 22% of costs and expenses,
respectively. Depreciation is recorded using the straight-line composite method over management’s estimate of the useful lives
of the related assets as listed below:
Cable distribution systems 7-20 years
Customer premise equipment and installations 3-8 years
Vehicles and equipment 3-6 years
Buildings and improvements 15-40 years
Furniture, fixtures and equipment 6-10 years
Intangible assets
Valuation and impairment of franchises. The net carrying value of franchises as of both December 31, 2015 and 2014 was
approximately $6.0 billion (representing 35% of total assets excluding restricted cash and cash equivalents). For more information
and a complete discussion of how we value and test franchise assets for impairment, see Note 6 to the accompanying consolidated
financial statements contained in “Part II. Item 8. Financial Statements and Supplementary Data.”
In 2015, we performed a qualitative impairment assessment that indicated the fair value of the franchise assets in each unit of
accounting exceeds the carrying value of such assets and thus resulted in no impairment. Our units of accounting for franchise
impairment testing is based on geographical clustering of our cable systems into groups or markets. For each franchise unit of
accounting, the estimated fair value of the franchise assets substantially exceeds the carrying value. Based on our qualitative
impairment assessment and sensitivity analyses, none of our franchise assets are considered at risk of impairment. Based on the
qualitative assessment, the franchise assets fair values are more than twice the carrying values for nearly all of the franchise units
of accounting. The only exception is a single market in which its fair value of franchise assets exceeds its carrying value by more
than 25%. The lower excess fair value of this market when compared to the others is attributed to the recent fair value measurement
of this market's franchise assets in purchase accounting.
Valuation and impairment of goodwill. The net carrying value of goodwill as of both December 31, 2015 and 2014 was
approximately $1.2 billion (representing 7% of total assets excluding restricted cash and cash equivalents). For more information
and a complete discussion on how we test goodwill for impairment, see Note 6 to the accompanying consolidated financial
statements contained in “Part II. Item 8. Financial Statements and Supplementary Data.” As with our franchise impairment testing,
in 2015 we elected to perform a qualitative assessment and concluded that goodwill is not impaired. Based on the qualitative
assessment and sensitivity analyses, implied goodwill is more than three times its carrying value.