Charter 2015 Annual Report Download - page 70
Download and view the complete annual report
Please find page 70 of the 2015 Charter annual report below. You can navigate through the pages in the report by either clicking on the pages listed below, or by using the keyword search tool below to find specific information within the annual report.-
 1
1 -
2
-
3
-
4
-
5
-
6
-
7
-
8
-
9
-
10
-
11
-
12
-
13
-
14
-
15
-
16
-
17
-
18
-
19
-
20
-
21
-
22
-
23
-
24
-
25
-
26
-
27
-
28
-
29
-
30
-
31
-
32
-
33
-
34
-
35
-
36
-
37
-
38
-
39
-
40
-
41
-
42
-
43
-
44
-
45
-
46
-
47
-
48
-
49
-
50
-
51
-
52
-
53
-
54
-
55
-
56
-
57
-
58
-
59
-
 60
60 -
 61
61 -
 62
62 -
 63
63 -
 64
64 -
 65
65 -
 66
66 -
 67
67 -
 68
68 -
 69
69 -
 70
70 -
 71
71 -
 72
72 -
 73
73 -
 74
74 -
 75
75 -
 76
76 -
 77
77 -
 78
78 -
 79
79 -
 80
80 -
81
-
82
-
83
-
84
-
85
-
86
-
87
-
88
-
89
-
90
-
91
-
92
-
93
-
94
-
95
-
96
-
97
-
98
-
99
-
100
-
101
-
102
-
103
-
104
-
105
-
106
-
107
-
108
-
109
-
110
-
111
-
112
-
113
-
114
-
115
-
116
-
117
-
118
-
119
-
120
-
121
-
122
-
123
-
124
-
125
-
126
-
127
-
128
-
129
-
130
-
131
-
132
-
133
-
134
-
135
-
136
-
137
-
138
-
139
-
140
-
141
-
142
-
143
-
144
-
145
-
146
-
147
-
148
-
149
-
150
-
151
-
152
 |
 |

55
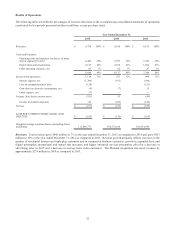
Programming costs were approximately $2.7 billion, $2.5 billion and $2.1 billion, representing 42%, 41% and 40% of operating
costs and expenses for each of the years ended December 31, 2015, 2014 and 2013, respectively. Programming costs consist
primarily of costs paid to programmers for basic, digital, premium, video on demand, and pay-per-view programming. The increase
in programming costs is primarily a result of annual contractual rate adjustments, including increases in amounts paid for
retransmission consents, broader carriage of certain networks as a result of our all-digital initiative and the introduction of new
networks to Charter's video offering as well as 2014 expense benefits not recurring in 2015. We expect programming expenses
to continue to increase due to a variety of factors, including annual increases imposed by programmers with additional selling
power as a result of media consolidation, increased demands by owners of broadcast stations for payment for retransmission
consent or linking carriage of other services to retransmission consent, and additional programming, particularly new sports
services. We have been unable to fully pass these increases on to our customers nor do we expect to be able to do so in the future
without a potential loss of customers.
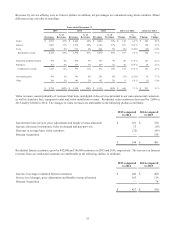
Costs to service customers include costs related to field operations, network operations and customer care for our residential and
small and medium business customers including internal and third party labor for installations, service and repair, maintenance,
billing and collection, occupancy and vehicle costs. The increase in costs to service customers was primarily the result of our
larger customer base and higher spending on labor to deliver improved products and service levels and, in 2014, higher collection
costs.
The increase in marketing costs during 2014 was the result of heavier sales activity and sales channel development.
Transition costs represent incremental costs incurred to increase the scale of our business as a result of the TWC Transaction,
Bright House Transaction and Comcast Transactions. The Comcast Transactions were terminated in April 2015. See "Part I. Item
1. Business" for a discussion regarding the TWC Transaction, Bright House Transaction and Comcast Transactions.
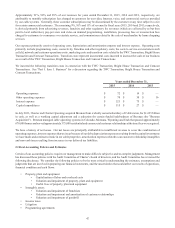
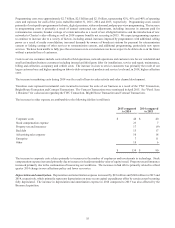
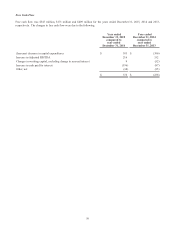
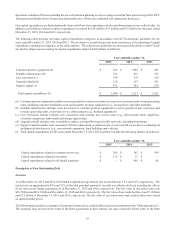
The increases in other expense are attributable to the following (dollars in millions):
2015 compared
to 2014
2014 compared
to 2013
Corporate costs $ 44 $ 40
Stock compensation expense 23 7
Property tax and insurance 17 (9)
Bad debt 15 17
Advertising sales expense 10 18
Enterprise 711
Other 18 6
$ 134 $ 90
The increase in corporate costs relates primarily to increases in the number of employees and investments in technology. Stock
compensation expense increased primarily due to increases in headcount and the value of equity issued. Property tax and insurance
increased primarily due to the continuation of insourcing our workforce. The increases in bad debt is primarily related to a third
quarter 2014 change in our collections policy and lower recoveries.
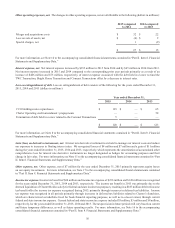
Depreciation and amortization. Depreciation and amortization expense increased by $23 million and $248 million in 2015 and
2014, respectively, which primarily represents depreciation on more recent capital expenditures offset by certain assets becoming
fully depreciated. The increase in depreciation and amortization expense in 2014 compared to 2013 was also affected by the
Bresnan Acquisition.