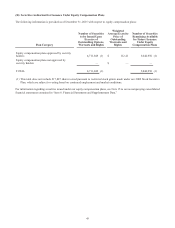
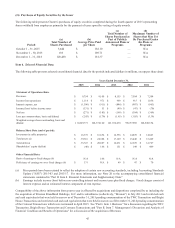
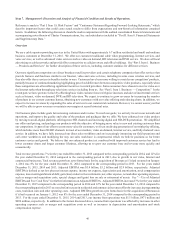
Charter 2015 Annual Report Download - page 68
Download and view the complete annual report
Please find page 68 of the 2015 Charter annual report below. You can navigate through the pages in the report by either clicking on the pages listed below, or by using the keyword search tool below to find specific information within the annual report.-
 1
1 -
2
-
3
-
4
-
5
-
6
-
7
-
8
-
9
-
10
-
11
-
12
-
13
-
14
-
15
-
16
-
17
-
18
-
19
-
20
-
21
-
22
-
23
-
24
-
25
-
26
-
27
-
28
-
29
-
30
-
31
-
32
-
33
-
34
-
35
-
36
-
37
-
38
-
39
-
40
-
41
-
42
-
43
-
44
-
45
-
46
-
47
-
48
-
49
-
50
-
51
-
52
-
53
-
54
-
55
-
56
-
57
-
 58
58 -
 59
59 -
 60
60 -
 61
61 -
 62
62 -
 63
63 -
 64
64 -
 65
65 -
 66
66 -
 67
67 -
 68
68 -
 69
69 -
 70
70 -
 71
71 -
 72
72 -
 73
73 -
 74
74 -
 75
75 -
 76
76 -
 77
77 -
 78
78 -
79
-
80
-
81
-
82
-
83
-
84
-
85
-
86
-
87
-
88
-
89
-
90
-
91
-
92
-
93
-
94
-
95
-
96
-
97
-
98
-
99
-
100
-
101
-
102
-
103
-
104
-
105
-
106
-
107
-
108
-
109
-
110
-
111
-
112
-
113
-
114
-
115
-
116
-
117
-
118
-
119
-
120
-
121
-
122
-
123
-
124
-
125
-
126
-
127
-
128
-
129
-
130
-
131
-
132
-
133
-
134
-
135
-
136
-
137
-
138
-
139
-
140
-
141
-
142
-
143
-
144
-
145
-
146
-
147
-
148
-
149
-
150
-
151
-
152
 |
 |

53
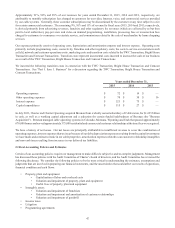
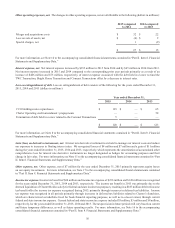
Revenues by service offering were as follows (dollars in millions; all percentages are calculated using whole numbers. Minor
differences may exist due to rounding):
Years ended December 31,
2015 2014 2013 2015 over 2014 2014 over 2013
Revenues
% of
Revenues Revenues
% of
Revenues Revenues
% of
Revenues Change
%
Change Change
%
Change
Video $ 4,587 47% $ 4,443 49% $ 4,040 50% $ 144 3.2 % $ 403 10 %
Internet 3,003 31% 2,576 28% 2,186 27% 427 16.6 % 390 18 %
Voice 539 6% 575 6% 644 8% (36) (6.4)% (69) (11)%
Residential revenue 8,129 83% 7,594 83% 6,870 84% 535 7.0 % 724 11 %
Small and medium business 764 8% 676 7% 553 7% 88 13.0 % 123 22 %
Enterprise 363 4% 317 3% 259 3% 46 14.8 % 58 22 %
Commercial revenue 1,127 12% 993 11% 812 10% 134 13.5 % 181 22 %
Advertising sales 309 3% 341 4% 291 4% (32) (9.5)% 50 17 %
Other 189 2% 180 2% 182 2% 9 5.0 % (2) (1)%
$ 9,754 100% $ 9,108 100% $ 8,155 100% $ 646 7.1 % $ 953 12 %
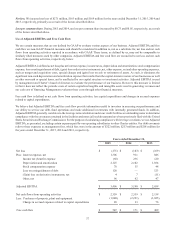
Video revenues consist primarily of revenues from basic and digital video services provided to our non-commercial customers,
as well as franchise fees, equipment rental and video installation revenue. Residential video customers decreased by 2,000 in
2015 and by 82,000 in 2014. The changes in video revenues are attributable to the following (dollars in millions):
2015 compared
to 2014
2014 compared
to 2013
Incremental video services, price adjustments and bundle revenue allocation $ 161 $ 330
Increase (decrease) in premium, video on demand and pay-per-view 15 (16)
Decrease in average basic video customers (32)(49)
Bresnan Acquisition — 138
$ 144 $ 403
Residential Internet customers grew by 442,000 and 386,000 customers in 2015 and 2014, respectively. The increases in Internet
revenues from our residential customers are attributable to the following (dollars in millions):
2015 compared
to 2014
2014 compared
to 2013
Increase in average residential Internet customers $ 242 $ 200
Service level changes, price adjustments and bundle revenue allocation 185 116
Bresnan Acquisition —74
$ 427 $ 390