Charter 2015 Annual Report Download - page 69
Download and view the complete annual report
Please find page 69 of the 2015 Charter annual report below. You can navigate through the pages in the report by either clicking on the pages listed below, or by using the keyword search tool below to find specific information within the annual report.-
 1
1 -
2
-
3
-
4
-
5
-
6
-
7
-
8
-
9
-
10
-
11
-
12
-
13
-
14
-
15
-
16
-
17
-
18
-
19
-
20
-
21
-
22
-
23
-
24
-
25
-
26
-
27
-
28
-
29
-
30
-
31
-
32
-
33
-
34
-
35
-
36
-
37
-
38
-
39
-
40
-
41
-
42
-
43
-
44
-
45
-
46
-
47
-
48
-
49
-
50
-
51
-
52
-
53
-
54
-
55
-
56
-
57
-
58
-
 59
59 -
 60
60 -
 61
61 -
 62
62 -
 63
63 -
 64
64 -
 65
65 -
 66
66 -
 67
67 -
 68
68 -
 69
69 -
 70
70 -
 71
71 -
 72
72 -
 73
73 -
 74
74 -
 75
75 -
 76
76 -
 77
77 -
 78
78 -
 79
79 -
80
-
81
-
82
-
83
-
84
-
85
-
86
-
87
-
88
-
89
-
90
-
91
-
92
-
93
-
94
-
95
-
96
-
97
-
98
-
99
-
100
-
101
-
102
-
103
-
104
-
105
-
106
-
107
-
108
-
109
-
110
-
111
-
112
-
113
-
114
-
115
-
116
-
117
-
118
-
119
-
120
-
121
-
122
-
123
-
124
-
125
-
126
-
127
-
128
-
129
-
130
-
131
-
132
-
133
-
134
-
135
-
136
-
137
-
138
-
139
-
140
-
141
-
142
-
143
-
144
-
145
-
146
-
147
-
148
-
149
-
150
-
151
-
152
 |
 |

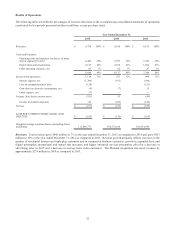
54
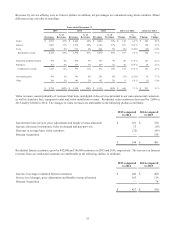
Residential voice customers grew by 159,000 and 166,000 customers in 2015 and 2014, respectively. The changes in voice revenues
from our residential customers are attributable to the following (dollars in millions):
2015 compared
to 2014
2014 compared
to 2013
Price adjustments and bundle revenue allocation $ (70)$ (135)
Increase in average residential voice customers 34 43
Bresnan Acquisition —23
$(36)$ (69)
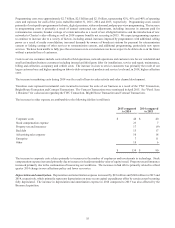
Small and medium business PSUs increased 109,000 and 84,000 in 2015 and 2014, respectively. The increases in small and
medium business commercial revenues are attributable to the following (dollars in millions):
2015 compared
to 2014
2014 compared
to 2013
Increase in small and medium business customers $ 112 $ 70
Price adjustments (24)21
Bresnan Acquisition —32
$ 88 $ 123
Enterprise PSUs increased 5,000 and 4,000 in 2015 and 2014, respectively. The increases in enterprise commercial revenues are
primarily due to growth in customers.
Advertising sales revenues consist primarily of revenues from commercial advertising customers, programmers and other vendors.
Advertising sales revenues decreased in 2015 primarily as a result of a decrease in political advertising of $29 million. Advertising
sales revenues increased in 2014 primarily as a result of an increase in political advertising of $30 million. The Bresnan Acquisition
increased advertising sales revenue by approximately $7 million in 2014 compared to the corresponding prior year period.
Other revenues consist of home shopping, late payment fees, wire maintenance fees and other miscellaneous revenues. The
increase in 2015 was primarily due to an increase in processing fees partially offset by a decrease in wire maintenance fees and
the decrease in 2014 was primarily due to a decrease in wire maintenance fees. The Bresnan Acquisition increased other revenues
in 2014 compared to the corresponding prior year period by approximately $2 million.
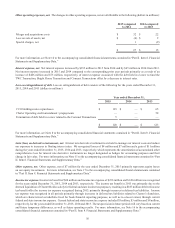
Operating costs and expenses. The increases in our operating costs and expenses are attributable to the following (dollars in
millions):
2015 compared
to 2014
2014 compared
to 2013
Programming $ 219 $ 234
Franchise, regulatory and connectivity 7 11
Costs to service customers 26 59
Marketing 940
Transition costs 58 14
Other 134 90
Bresnan Acquisition — 180
$ 453 $ 628