Charter 2015 Annual Report Download - page 77
Download and view the complete annual report
Please find page 77 of the 2015 Charter annual report below. You can navigate through the pages in the report by either clicking on the pages listed below, or by using the keyword search tool below to find specific information within the annual report.-
 1
1 -
2
-
3
-
4
-
5
-
6
-
7
-
8
-
9
-
10
-
11
-
12
-
13
-
14
-
15
-
16
-
17
-
18
-
19
-
20
-
21
-
22
-
23
-
24
-
25
-
26
-
27
-
28
-
29
-
30
-
31
-
32
-
33
-
34
-
35
-
36
-
37
-
38
-
39
-
40
-
41
-
42
-
43
-
44
-
45
-
46
-
47
-
48
-
49
-
50
-
51
-
52
-
53
-
54
-
55
-
56
-
57
-
58
-
59
-
60
-
61
-
62
-
63
-
64
-
65
-
66
-
 67
67 -
 68
68 -
 69
69 -
 70
70 -
 71
71 -
 72
72 -
 73
73 -
 74
74 -
 75
75 -
 76
76 -
 77
77 -
 78
78 -
 79
79 -
 80
80 -
 81
81 -
 82
82 -
 83
83 -
 84
84 -
 85
85 -
 86
86 -
 87
87 -
88
-
89
-
90
-
91
-
92
-
93
-
94
-
95
-
96
-
97
-
98
-
99
-
100
-
101
-
102
-
103
-
104
-
105
-
106
-
107
-
108
-
109
-
110
-
111
-
112
-
113
-
114
-
115
-
116
-
117
-
118
-
119
-
120
-
121
-
122
-
123
-
124
-
125
-
126
-
127
-
128
-
129
-
130
-
131
-
132
-
133
-
134
-
135
-
136
-
137
-
138
-
139
-
140
-
141
-
142
-
143
-
144
-
145
-
146
-
147
-
148
-
149
-
150
-
151
-
152
 |
 |
62
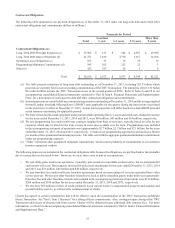
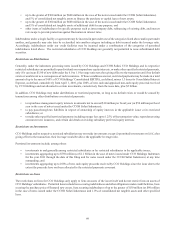
Limitations on Distributions
Distributions by Charter’s subsidiaries to a parent company for payment of principal on parent company notes are restricted under
indentures and credit facilities governing our indebtedness, unless there is no default under the applicable indenture and credit
facilities, and unless each applicable subsidiary’s leverage ratio test is met at the time of such distribution. As of December 31,
2015, there was no default under any of these indentures or credit facilities and each subsidiary met its applicable leverage ratio
tests based on December 31, 2015 financial results. Such distributions would be restricted, however, if any such subsidiary fails
to meet these tests at the time of the contemplated distribution. In the past, certain subsidiaries have from time to time failed to
meet their leverage ratio test. There can be no assurance that they will satisfy these tests at the time of the contemplated distribution.
Distributions by Charter Operating for payment of principal on parent company notes are further restricted by the covenants in
its credit facilities.
In addition to the limitation on distributions under the various indentures discussed above, distributions by our subsidiaries may
be limited by applicable law, including the Delaware Limited Liability Company Act, under which our subsidiaries may only make
distributions if they have “surplus” as defined in the act.
Historical Operating, Investing, and Financing Activities
Cash and Cash Equivalents. We held $5 million and $3 million in cash and cash equivalents as of December 31, 2015 and 2014,
respectively. We also held $22.3 billion and $7.1 billion in restricted cash and cash equivalents as of December 31, 2015 and
December 31, 2014, respectively.
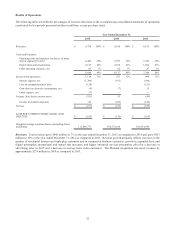
Operating Activities. Net cash provided by operating activities remained flat at $2.4 billion for the year ended December 31, 2015
and 2014.
Net cash provided by operating activities increased $201 million from $2.2 billion for the year ended December 31, 2013 to $2.4
billion for the year ended December 31, 2014, primarily due to an increase in Adjusted EBITDA of $332 million offset by an $87
million increase in cash paid for interest and a $22 million increase in merger and acquisition costs.
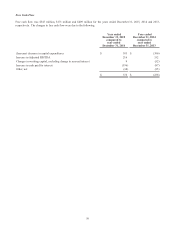
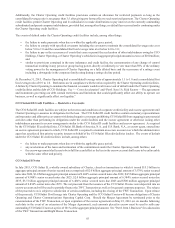
Investing Activities. Net cash used in investing activities for the years ended December 31, 2015, 2014 and 2013, was $17.0
billion, $9.3 billion and $2.4 billion, respectively. The increase in 2015 compared to 2014 is primarily due to an increase in the
investment of net proceeds from the issuance of the CCO Safari II notes, CCO Safari III credit facilities and CCOH Safari notes
related to the TWC Transaction in long-term restricted cash and cash equivalents offset by a decrease in long-term restricted cash
and cash equivalents upon repayment of the Term G Loans and CCOH Safari notes out of escrow related to the Comcast Transactions
and a decrease in capital expenditures. The increase in 2014 compared to 2013 is primarily due to the investment of $7.1 billion
of net proceeds from the issuance of the Term G Loans and CCOH Safari notes issued in connection with the Comcast Transactions
in long-term restricted cash and cash equivalents, and higher capital expenditures offset by $676 million cash paid for the Bresnan
Acquisition (net of debt assumed) in 2013.
Financing Activities. Net cash provided in financing activities was $14.7 billion, $6.9 billion and $299 million for the years ended
December 31, 2015, 2014 and 2013, respectively. The increase in cash provided during the year ended December 31, 2015 as
compared to the corresponding period in 2014 was primarily the result of the issuance of the CCO Safari II notes, CCO Safari III
credit facilities and CCOH Safari notes related to the TWC Transaction offset by the repayment of $7.1 billion of net proceeds
held in escrow related to the CCOH Safari notes and Term G Loans upon the termination of the Comcast Transactions. The
increase in cash provided during the year ended December 31, 2014 as compared to the corresponding period in 2013, was primarily
due to the issuance of the Term G Loans and CCOH Safari notes in 2014 related to the Comcast Transactions.
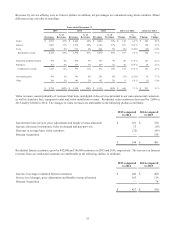
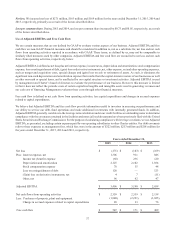
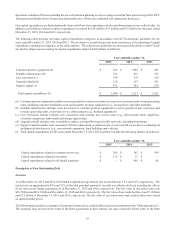
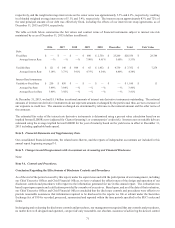
Capital Expenditures
We have significant ongoing capital expenditure requirements. Capital expenditures were $1.8 billion, $2.2 billion and $1.8 billion
for the years ended December 31, 2015, 2014 and 2013, respectively. The decrease was driven by the completion of our all-
digital transition in 2014 offset by higher product development investments and incremental transition capital expenditures incurred
in connection with the TWC Transaction, Bright House Transaction and Comcast Transactions. Excluding transition-related
expenditures, capital expenditures were $1.7 billion for the year ended December 31, 2015. See the table below for more details.
We anticipate 2016 capital expenditures to be driven by growth in residential and commercial customers along with further spend
related to product development and transition-related expenditures. The actual amount of our capital expenditures in 2016 will