GE 2007 Annual Report Download - page 2
Download and view the complete annual report
Please find page 2 of the 2007 GE annual report below. You can navigate through the pages in the report by either clicking on the pages listed below, or by using the keyword search tool below to find specific information within the annual report.-
 1
1 -
 2
2 -
 3
3 -
 4
4 -
 5
5 -
 6
6 -
 7
7 -
 8
8 -
 9
9 -
 10
10 -
 11
11 -
 12
12 -
 13
13 -
14
-
15
-
16
-
17
-
18
-
19
-
20
-
21
-
22
-
23
-
24
-
25
-
26
-
27
-
28
-
29
-
30
-
31
-
32
-
33
-
34
-
35
-
36
-
37
-
38
-
39
-
40
-
41
-
42
-
43
-
44
-
45
-
46
-
47
-
48
-
49
-
50
-
51
-
52
-
53
-
54
-
55
-
56
-
57
-
58
-
59
-
60
-
61
-
62
-
63
-
64
-
65
-
66
-
67
-
68
-
69
-
70
-
71
-
72
-
73
-
74
-
75
-
76
-
77
-
78
-
79
-
80
-
81
-
82
-
83
-
84
-
85
-
86
-
87
-
88
-
89
-
90
-
91
-
92
-
93
-
94
-
95
-
96
-
97
-
98
-
99
-
100
-
101
-
102
-
103
-
104
-
105
-
106
-
107
-
108
-
109
-
110
-
111
-
112
-
113
-
114
-
115
-
116
-
117
-
118
-
119
-
120
 |
 |

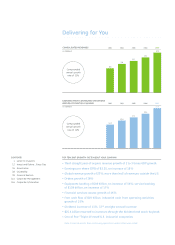
Delivering for You
152
137
124
105
173
2003 2004 2005 2006 2007
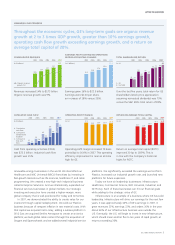
CONSOLIDATED REVENUES
(In $ billions)
Compounded
annual growth
rate of 13%
19.4
17.4
15.6
13.3
22.5
2003 2004 2005 2006 2007
EARNINGS FROM CONTINUING OPERATIONS
BEFORE ACCOUNTING CHANGES
(In $ billions)
Compounded
annual growth
rate of 14%
•
Third straight year of organic revenue growth of 2 to 3 times GDP growth
•
Earnings per share (EPS) of $2.20, an increase of 18%
•
Global revenue growth of 22%, more than half of revenues outside the U.S.
•
Orders growth of 18%
•
Equipment backlog of $49 billion, an increase of 54%; service backlog
of $109 billion, an increase of 17%
•
Financial services assets growth of 16%
•
Free cash fl ow of $19 billion; industrial cash from operating activities
growth of 15%
•
Dividend increase of 11%, 32nd straight annual increase
•
$25.4 billion returned to investors through the dividend and stock buyback
•
One of fi ve “Triple-A”-rated U.S. industrial companies
Note: Financial results from continuing operations unless otherwise noted
TOP TEN 2007 GROWTH FACTS ABOUT YOUR COMPANY
CONTENTS
1 Letter to Investors
12 Invest and Deliver … Every Day
36 Governance
38 Citizenship
39 Financial Section
114 Corporate Management
116 Corporate Information