GE 2007 Annual Report Download - page 85
Download and view the complete annual report
Please find page 85 of the 2007 GE annual report below. You can navigate through the pages in the report by either clicking on the pages listed below, or by using the keyword search tool below to find specific information within the annual report.-
 1
1 -
2
-
3
-
4
-
5
-
6
-
7
-
8
-
9
-
10
-
11
-
12
-
13
-
14
-
15
-
16
-
17
-
18
-
19
-
20
-
21
-
22
-
23
-
24
-
25
-
26
-
27
-
28
-
29
-
30
-
31
-
32
-
33
-
34
-
35
-
36
-
37
-
38
-
39
-
40
-
41
-
42
-
43
-
44
-
45
-
46
-
47
-
48
-
49
-
50
-
51
-
52
-
53
-
54
-
55
-
56
-
57
-
58
-
59
-
60
-
61
-
62
-
63
-
64
-
65
-
66
-
67
-
68
-
69
-
70
-
71
-
72
-
73
-
74
-
 75
75 -
 76
76 -
 77
77 -
 78
78 -
 79
79 -
 80
80 -
 81
81 -
 82
82 -
 83
83 -
 84
84 -
 85
85 -
 86
86 -
 87
87 -
 88
88 -
 89
89 -
 90
90 -
 91
91 -
 92
92 -
 93
93 -
 94
94 -
 95
95 -
96
-
97
-
98
-
99
-
100
-
101
-
102
-
103
-
104
-
105
-
106
-
107
-
108
-
109
-
110
-
111
-
112
-
113
-
114
-
115
-
116
-
117
-
118
-
119
-
120
 |
 |

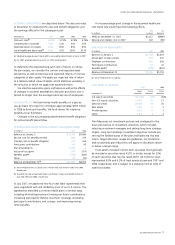
ge 2007 annual report 83
2007 2006
Gross Gross Gross Gross
Amortized unrealized unrealized Estimated Amortized unrealized unrealized Estimated
December 31 (In millions) cost gains losses fair value cost gains losses fair value
GE
Debt — U.S. corporate $ 301 $ 23 $ — $ 324 $ 307 $ 24 $ — $ 331
Equity — available-for-sale 21 3 (5) 19 10 2 (1) 11
322 26 (5) 343 317 26 (1) 342
GECS
Debt
U.S. corporate 21,936 725 (669) 21,992 21,129 1,039 (202) 21,966
State and municipal 1,106 28 (8) 1,126 826 38 (4) 860
Residential mortgage-backed
(a) 5,677 22 (225) 5,474 6,476 18 (21) 6,473
Commercial mortgage-backed 2,930 15 (49) 2,896 2,322 18 (25) 2,315
Asset-backed 2,307 3 (89) 2,221 2,071 5 (11) 2,065
Corporate — non-U.S. 1,489 47 (11) 1,525 1,664 92 (5) 1,751
Government — non-U.S. 1,082 70 (10) 1,142 1,296 105 (3) 1,398
U.S. government and federal agency 832 55 (37) 850 842 47 (6) 883
Retained interests
(b)(c) 5,691 178 (57) 5,812 3,794 434 (13) 4,215
Equity
Available-for-sale 1,524 265 (120) 1,669 4,446 1,060 (14) 5,492
Trading 386 — — 386 54 — — 54
44,960 1,408 (1,275) 45,093 44,920 2,856 (304) 47,472
ELIMINATIONS (7) (1) — (8) (7) (1) — (8)
Total
$45,275 $1,433 $(1,280) $45,428 $45,230 $2,881 $(305) $47,806
(a) Substantially collateralized by U.S. mortgages.
(b) Included $2,339 million of retained interests at December 31, 2007, accounted for in accordance with SFAS 155, Accounting for Certain Hybrid Financial Instruments. See note 27.
(c) Amortized cost and estimated fair value included $25 million of trading securities at December 31, 2007.
Note 9
Investment Securities
Investment securities comprise mainly investment-grade debt
securities supporting obligations to annuitants and policyholders
in our run-off insurance businesses and holders of guaranteed
investment contracts.