GE 2007 Annual Report Download - page 86
Download and view the complete annual report
Please find page 86 of the 2007 GE annual report below. You can navigate through the pages in the report by either clicking on the pages listed below, or by using the keyword search tool below to find specific information within the annual report.-
 1
1 -
2
-
3
-
4
-
5
-
6
-
7
-
8
-
9
-
10
-
11
-
12
-
13
-
14
-
15
-
16
-
17
-
18
-
19
-
20
-
21
-
22
-
23
-
24
-
25
-
26
-
27
-
28
-
29
-
30
-
31
-
32
-
33
-
34
-
35
-
36
-
37
-
38
-
39
-
40
-
41
-
42
-
43
-
44
-
45
-
46
-
47
-
48
-
49
-
50
-
51
-
52
-
53
-
54
-
55
-
56
-
57
-
58
-
59
-
60
-
61
-
62
-
63
-
64
-
65
-
66
-
67
-
68
-
69
-
70
-
71
-
72
-
73
-
74
-
75
-
 76
76 -
 77
77 -
 78
78 -
 79
79 -
 80
80 -
 81
81 -
 82
82 -
 83
83 -
 84
84 -
 85
85 -
 86
86 -
 87
87 -
 88
88 -
 89
89 -
 90
90 -
 91
91 -
 92
92 -
 93
93 -
 94
94 -
 95
95 -
 96
96 -
97
-
98
-
99
-
100
-
101
-
102
-
103
-
104
-
105
-
106
-
107
-
108
-
109
-
110
-
111
-
112
-
113
-
114
-
115
-
116
-
117
-
118
-
119
-
120
 |
 |

84 ge 2007 annual report
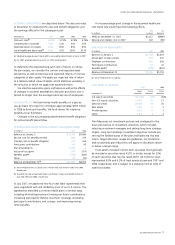
The following tables present the gross unrealized losses and
estimated fair values of our available-for-sale investment securities.
In loss position for
Less than 12 months 12 months or more
Gross Gross
Estimated unrealized Estimated unrealized
December 31 (In millions) fair value losses fair value losses
2007
Debt
U.S. corporate $ 5,766 $(274) $ 4,341 $(395)
State and municipal 198 (3) 131 (5)
Residential mortgage-
backed 3,268 (160) 1,223 (65)
Commercial mortgage-
backed 1,483 (33) 848 (16)
Asset-backed 1,417 (62) 478 (27)
Corporate — non-U.S. 505 (8) 124 (3)
Government — non-U.S. 29 (1) 311 (9)
U.S. government and
federal agency 255 (37) — —
Retained interests 548 (50) 10 (7)
Equity 443 (105) 18 (20)
Total $13,912 $(733) $ 7,484 $(547)
2006
Debt
U.S. corporate $ 2,483 $ (52) $ 4,242 $(150)
State and municipal 149 (2) 70 (2)
Residential mortgage-
backed 1,149 (3) 776 (18)
Commercial mortgage-
backed 442 (2) 1,010 (23)
Asset-backed 260 (2) 611 (9)
Corporate — non-U.S. 112 (3) 93 (2)
Government — non-U.S. 33 (3) — —
U.S. government and
federal agency 66 (1) 247 (5)
Retained interests 360 (12) 13 (1)
Equity 40 (12) 3,895 (3)
Total $ 5,094 $ (92) $10,957 $(213)
At December 31, 2007, we held mortgage-backed securities (MBS)
and asset-backed securities (ABS) with estimated fair values of
$8,370 million and $2,221 million, respectively. Such amounts
included unrealized losses of $274 million and $89 million, respec-
tively. These amounts excluded retained interests in securitization
entities. See note 27. Of the MBS amount, $5,474 million and
$2,896 million related to residential MBS and commercial MBS,
respectively. At December 31, 2007, we had approximately
$1,635 million of exposure to subprime credit supporting our
guaranteed investment contracts, a majority of which relates to
residential MBS receiving credit ratings of Double A or better
from the major rating agencies. We presently intend to hold our
investment securities that are in an unrealized loss position at
December 31, 2007, at least until we can recover their respective
amortized cost. We have the ability to hold our debt securities
until their maturities. Our subprime investment securities were
collateralized primarily by pools of individual, direct mortgage
loans, not other structured products such as collateralized debt
obligations.
CONTRACTUAL MATURITIES OF GECS INVESTMENT IN AVAILABLE-
FOR-SALE DEBT SECURITIES (EXCLUDING MORTGAGE-BACKED AND
ASSET-BACKED SECURITIES)
Amortized Estimated
(In millions) cost fair value
Due in
2008 $ 1,830 $ 1,831
2009 – 2012 4,227 4,245
2013 – 2017 3,580 3,607
2018 and later 16,808 16,952
We expect actual maturities to differ from contractual
maturities because borrowers have the right to call or prepay
certain obligations.
Supplemental information about gross realized gains and
losses on available-for-sale investment securities follows.
(In millions)
2007 2006 2005
GE
Gains $ 5 $ 125 $ 6
Losses, including impairments — (1) (5)
Net
5 124 1
GECS
Gains
(a) 1,026 313 509
Losses, including impairments (141) (181) (132)
Net
885 132 377
Total
$ 890 $ 256 $ 378
(a) Included gain on sale of Swiss Re common stock of $566 million in 2007.
In the ordinary course of managing our investment securities
portfolio, we may sell securities prior to their maturities for a
variety of reasons, including diversifi cation, credit quality, yield and
liquidity requirements and the funding of claims and obligations
to policyholders.
Proceeds from investment securities sales amounted to
$18,993 million, $12,394 million and $14,047 million in 2007, 2006
and 2005, respectively, principally from the short-term nature
of the investments that support the guaranteed investment
contracts portfolio and the 2007 sale of Swiss Re common stock.
We recognized pre-tax gains on trading securities of $292
million, $5 million and $3 million in 2007, 2006 and 2005, respec-
tively. Investments in retained interests decreased by $106 million
during 2007, refl ecting declines in fair value accounted for in
accordance with SFAS 155.